Hello everyone, this is season 5 week 2 of the steemit crypto academy. This week’s lecture was delivered by professor @utsavsaxena11 and the topic was centered on "Trading Strategy for Head and Shoulders and Inverted Head and Shoulders Pattern." After reading through the lesson and understanding it properly, I have decided to try my hands on the given task.
Explain Head and Shoulder and Inverse Head and Shoulders patterns in details with the help of real examples. What is the importance of voulme in these patterns(Screenshot needed and try to explian in details)
We use fundamental and technical analysis in trading to analyze various trades. Fundamental analysis means relying on various statistics such as news surrounding the crypto asset, the events happening around it and other relevant financial statistics to be able to predict the direction in which the price of an asset will move. Technical analysis on the other hand relies on the use of technical analysis tools such as charts and indicators to study the behavior of the prices of assets. These technical analysis tools rely on the past actions of the buyers and sellers of the asset to predict the movement of the asset on a long term or short term basis.
like mentioned earlier, chart pattern is on the technical analysis tools which is used in technical analysis. These chat patterns are of different variations and categories. They are generally categorized into trend continuation patterns and trend reversal patterns. under the trend reversal pattern, we have the head and shoulder and inverted head and shoulder pattern.
Head and Shoulder Pattern
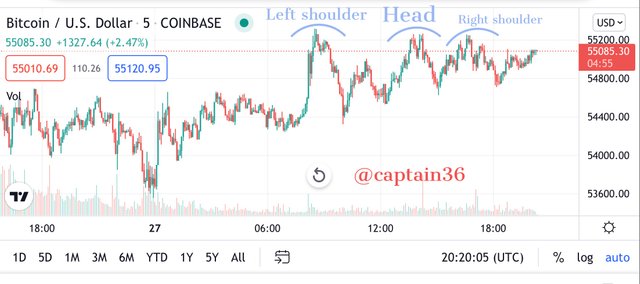
The regular head and shoulder pattern and the inverse head and shoulder are very similar but the only difference is that they are in opposite directions. The inverse head and shoulder pattern occurs when there is an uptrend and then the trend reverses suddenly to move in a downward direction and then an upside-down curve is formed. There are three sharkfins in the inverse head and shoulder pattern as well. These sharkfins are inverted and the middle one is always the longest and is called the head.
Inverted Head and Shoulder Pattern
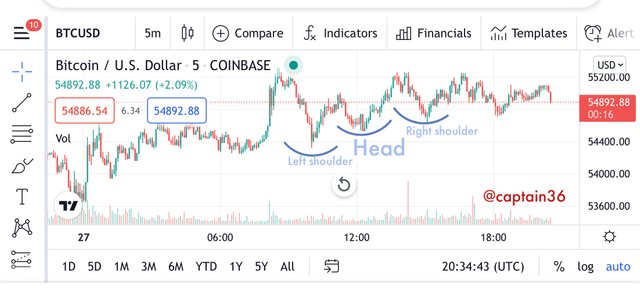
The inverted head and shoulder pattern occurs when there is a sudden change in the direction from a downtrend to an uptrend. This leads to the formation of inverted curves on the chat. This often happens as a result of the increase in the volume of the asset which in turn increases the price of the asset suddenly. As we all know the increase in the volume of an asset will definitely mean there will be an increase in the price of that particular asset. This indicates why volume is a very important factor in the inverted head and shoulder pattern.
The increase in volume could be as a result of the injection of volume by the dominant investors in the ecosystem known as whales. These same whales could also withdraw their volume which will lead to the overall reduction in the volume of the market.

What is the psychology of market in Head and Shoulder pattern and in Inverse Head and Shoulder pattern (Screenshot needed)
Psychology of market in Head and Shoulder Pattern
Another name given to the head and shoulder pattern is bullish-bearish reversal trend. This is because the head and shoulder pattern occurs when a bullish is about ending and then a bearish is about to take over.
Trend continuatons and trend reversals are identified by the use of these technical strategy. The downward trend are identified by the use of the head and shoulder patterns. At the start of the trend, it shows an upward movement until the downtrend appears later which is called the shoulder.
At the point of the trend reversal is when the traders usually decide to place their orders. But when the new shoulder is formed, it proves that there was a fakeout because the first shoulder did not reach or exceed the head level of the pattern. Fakeouts occur in the market when dominant traders decide to exit the market and prices begin to fall. When signs of these fakeouts are shown, majority of traders begin to exit the market hence the large fall of prices in the market.
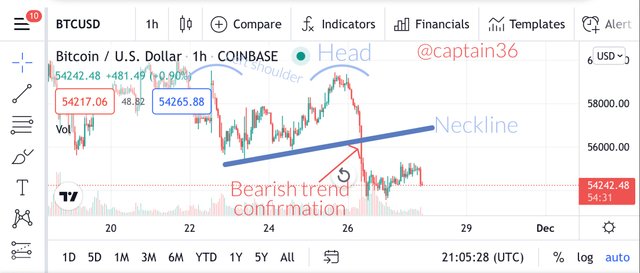
Looking at the scrreenshot above, a neckline was drawn in a way that it cuts the end of every peak level. After this we ensure that the price breaks these marked levels before we decide on joining the market. We also have to leave the market when a downward trend moves beneath the neckline as this is an indication that there is going to fall in prices.
Psychology of Market in Inverted Head and Shoulder Pattern
The inverted head and shoulder pattern is the direct opposite of the head and shoulder pattern we discussed above. The inverted head shoulder pattern is used to identify a bullish trend reversal which usually happens immediately at the end of a downward trend. At the beginning a downward trend happens and then an inverted curve occurs suddenly which indicates a fakeout an gives an indication that the direction of the price will change and there will be a bullish trend.
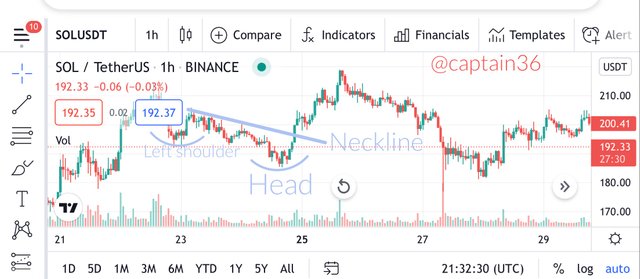
Looking at the chart above, a neckline was drawn that has to cut the edges at the lower peak. An indication of a bullish trend reversal is signaled at the time the price moves across the neckline. We have to be sure that the market is ready for our entry so we wait for a strong bullish trend to start then we can enter the market at this point.

Explain 1 demo trade for Head and Shoulder and 1 demo trade for Inverse Head and shoulder pattern. Explain proper trading strategy in both patterns seperately. Explain how you identified different levels in the trades in each pattern(Screenshot needed and you can use previous price charts in this question)
Trade for Head and Shoulder
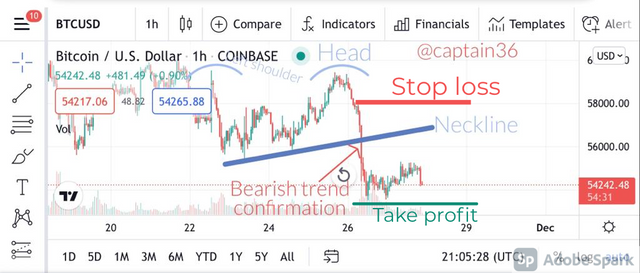
The strategy for this trade is a very straight forward on. The procedure involved are as follows;
- First of all we have to spot the head and shoulder patterns.
- Then the next step is that we draw a neckline. This neckline should cut the lower peak level at its edge.
- At this point we expect a bullish candle to overlap the drawn neckline. After this has been established, we then place a sell order at the point the clear bullish candle has been identified.
- Then we will place the stop loss as seen in the chat below.
- A take profit will also be set which will point at the time we are supposed to leave the market with our profit.
Trade for Inverted Head and Shoulder
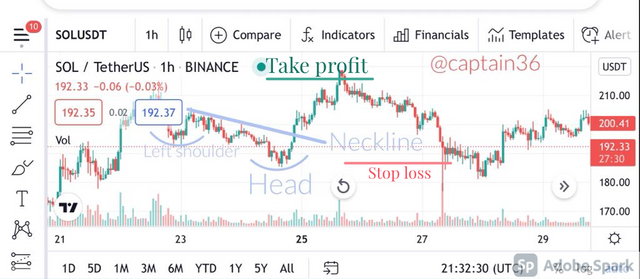
The procedure in the trade of the inverted head and shoulder is very similar to the trade of the head and shoulder trade. lets look at the steps below;
- The first step as usual is to spot the inverted head and shoulder pattern
- Then after that we have to then make sure that the neckline is put across the peak at its edge.
- At this point, the candle that is expected to break the neckline is a bearish candle. Then after the bearish candle breaks the line, we can then enter the market.
- At this point the stop loss and the take profit are both placed to leave the market when there is a loss or profit respectively.

Place 1 real trade for Head and Shoulder(atleast $10) OR 1 trade for Inverse Head and Shoulder pattern(atleast $10) in your verified exchange account. Explain proper trading strategy and provide screenshots of price chart at the entry and at the end of trade also provide screenshot of trade details.(Screenshot needed.)
Using Head and Shoulder
The chat below is the chart I used to indicate the usage of the head and shoulder.
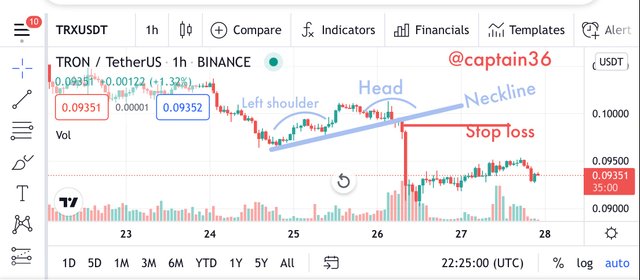
my first task I fulfilled was that I had to to spot the head and shoulder pattern. After spotting them, I then had to draw a neckline at the egdes of the peaks at the lower level. Then before I made an entry into the market, I had to ensure that there is a downward candle the exceeds the point i placed the neckline. The stop loss was placed at exactly the place the breakage of the neckline occurs.
At this point as seen in the chat above, my stop loss was placed at 0.099. Then i set my take profit ratio as 1:1.
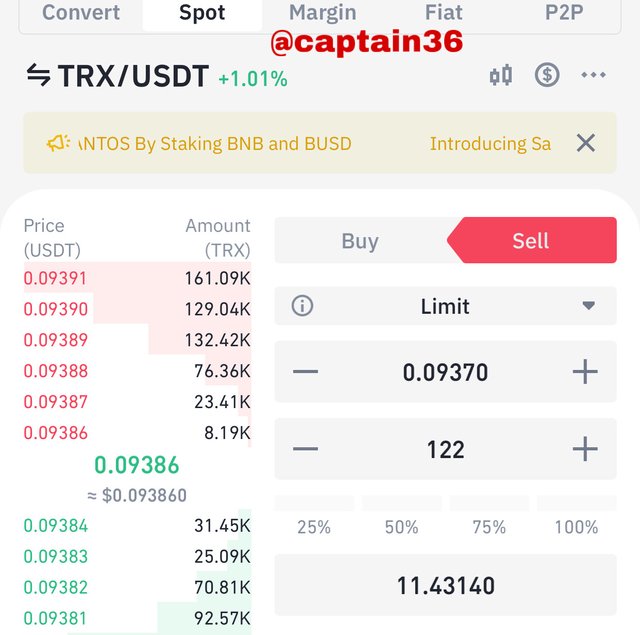
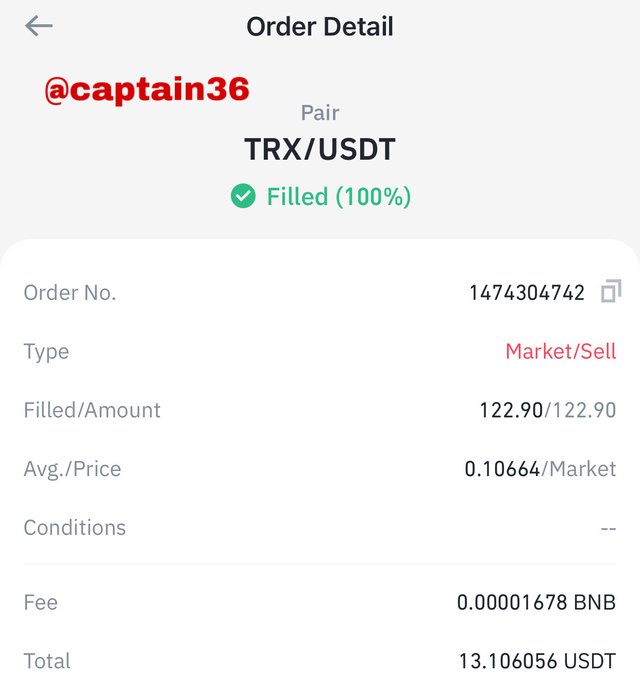
The price reached the stop loss point first so we had to stop the trade at a loss. It means that our trade ended up with a loss which is very unfortunate. These kind of risks are present in trading of crypto currencies and it would have been better if we used some indicators to support the strategies we used. The smaller time frame we chose was also very risky for the trade.
This is why we don’t have to invest what we can’t afford to lose in crypto trading.

Conclusion
These strategies used in technical analysis to predict prices of assets gives us very quick results though the results is not 100% reliable. These strategies gives results faster than the use of technical indicators which need some time before they display their results.
However the best way to use these strategies is to combine them with the technical indicators so that a very accurate result can be attained with respect to the prices of crypto assets.
Thank you once again professor @utsavsaxena11 for this detailed lecture.