Hello everyone, this is the season 4 of the steemit crypto academy. I’m very happy to take part of this beginner level task delivered by professor @reminiscence01. The lecture was on Candlestick patterns. The question I chose to answer is stated below.
1a) Explain the Japanese candlestick chart? (Original screenshot required).
b) In your own words, explain why the Japanese Candlestick chart is the most used in the financial market.
c) Describe a bullish and a bearish candle. Also, explain its anatomy. (Original screenshot required)
Explain the Japanese candlestick chart? (Original screenshot required).
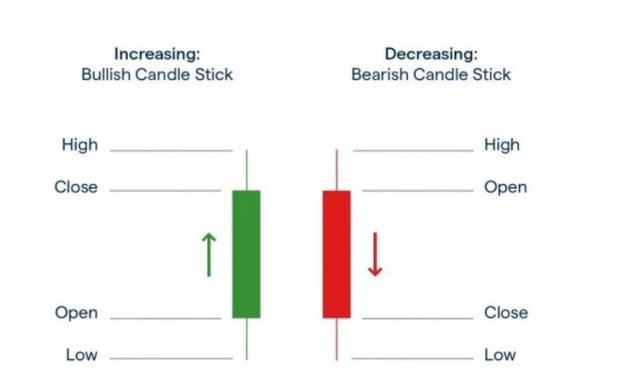
source
The Japanese candlestick is a graphical representation of the movement of prices of an asset due to the interactions between buyers and sellers at a particular time frame. These Japanese candlestick were developed in Japan in the 1700s and hence the name “Japanese candlesticks”. The candlestick is divided into four main parts namely the opening price, closing price, high and low. These features determines the state of the candlestick at a particular time.
The opening price depicts the beginning of the candlestick. It is the point at which the price starts at.
The closing price indicates the end of the candlestick and hence the ending point of the price of the asset.
The high point depicts the highest price of the candlestick whilst the low point is an indication of the lowest point of the candlestick and highlights the lowest price.
The change of price at a particular time is known through the length of the candlestick.
The Japanese candlesticks are very important technical analysis tools for cryptocurrency traders.
The current price of an asset as well as the movement of the price of an asset are all represented by the candlestick. The upward movement of the candle indicates a bullish movement in the market whilst the downward movement of a candle represents a bearish trend in the market. The candlesticks are of different types depending on their behavior at a particular time. Examples of such are the bullish engulfing, bearish engulfing, doji etc. The presence of any form of these candlesticks represents a type of pattern in the market. These patterns are used to predict the prices of the assets at that point in time and even for the future.
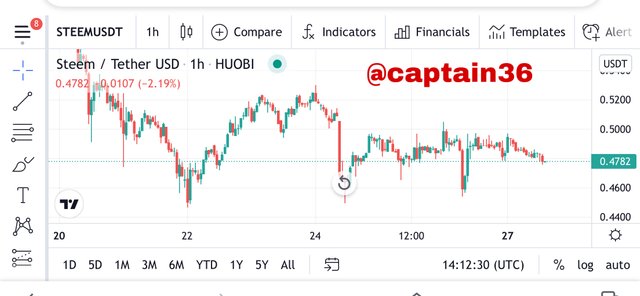
The above is a STEEM/USDT 1h chart. It can be observed that the chart moved down in a zig zag form and then rised in a zig zag form again. The chart made a downward movement again and then it is moving in stable direction now.

b) In your own words, explain why the Japanese Candlestick chart is the most used in the financial market.
The Japanese candlesticks are the most used candlesticks in the cryptocurrency market. This is because the provide a lot of advantages as compared to other candlesticks and some of these factors are discussed below:
The Japanese candlesticks are very easy to read and comprehend. These charts are always presented very clearly and even beginners can read and understand them easily. They can be interpreted easily as well.
The trends of past markets, current markets and the predictions for the future markets can all be seen in the candlesticks. These factors help traders to understand the market better. This is one major advantage the Japanese candlesticks has over other charts.
The candlesticks can be combined with other technical indicators to provide the best predictions for the market. The indicators make the candlesticks very effective and the combination give very accurate results.
Like we discussed earlier the candlesticks give information all aspects of the market. The highest point of the market, the lowest point, the open price and close price are all indicated in the candlesticks. This makes them provide more information on market prices than other charts.

c) Describe a bullish and a bearish candle. Also, explain its anatomy. (Original screenshot required)
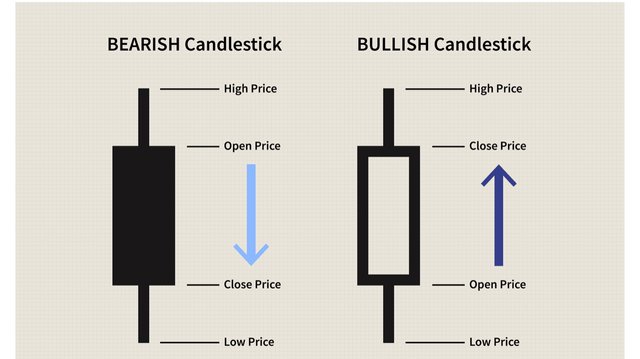
source
Anatomy of a candle
The screenshot above depicts the anatomy of both the bullish and bearish candles. The candle consists of four different points as indicated earlier. These price points include; opening price, closing price, high and low. The main body of the candle is the section between the opening price and the closing price. These candles also have wicks. The wicks are the points immediately above the opening price point and also immediately below the closing price point. These wicks at the top of the opening indicates the highest price of the asset at a specific time whilst the wick at the bottom of the closing price indicates the lowest price of the asset at a specific time. The price range is represented by the gap between the top of the candle and the bottom of the candle at a particular time interval.
Bullish Candle
A bullish candle occurs when the buyers dominate the market. In the bullish candle the closing price is higher than the opening price. The closing price is the upper part and the opening price is the lower part.
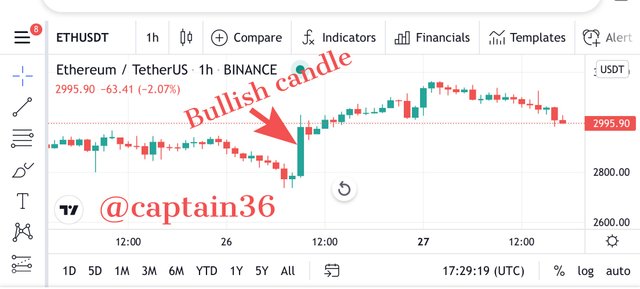
The above screenshot is a bullish candle. The opening price, the closing price candle all be seen clearly. The wicks are also present.
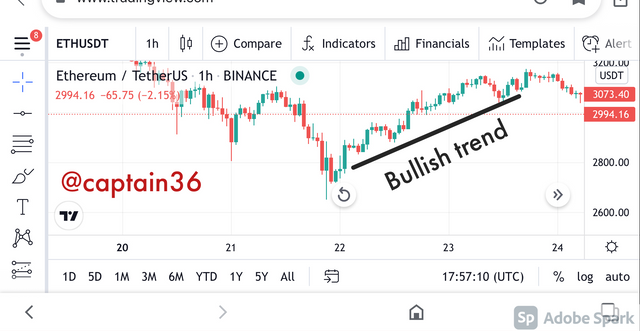
The chart above shows a bullish trend. It means the price of that asset moved upwards within that specific period and there was an uptrend. This means that the buyers dominated the market at this particular time.
Bearish Candle
A bearish candle on the other hand occurs when the sellers take control over the market. In the bearish candle the opening price is higher than the closing price.
The opening price is the upper part and the closing price is the lower part.
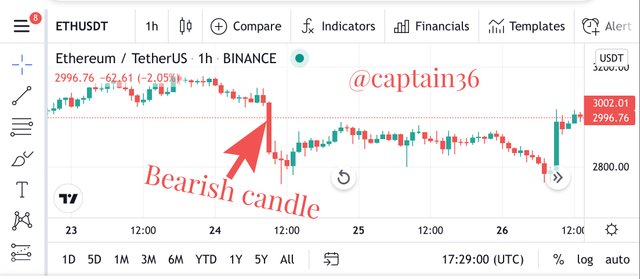
The above screenshot is a bearish candle. The opening price, the closing price candle all be seen clearly. The wicks are also present.
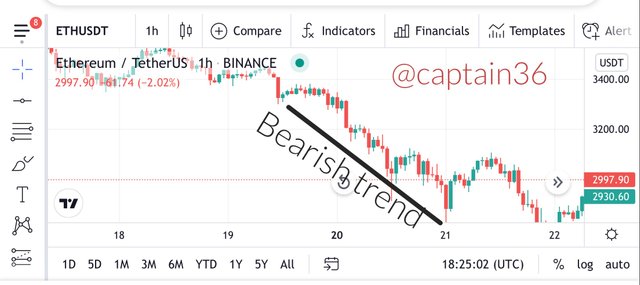
The chart above shows a bearish trend. It means the price of that asset moved downwards within that specific period and there was a downtrend. This means that the sellers dominated the market at this particular time.

Conclusion
Candlesticks are used in technical analysis to predict prices of cryptocurrencies. These candlesticks use the current price, the previous price , the highest price as well as the lowest price at a particular point in time to make predictions for future prices.
They are very simple to understand and they are also the most used charts if market analysis.
Thank you once again professor @reminiscence01 for this detailed lecture.