
Season greetings to everyone, it’s another week of learning new concepts about crypto on this platform. For this week's course presented by one of our reputable professors @kouba01 based on the Indicator Linear Regression. After going through the lesson, and doing some additional research, I will present my homework task as seen below.
Question 1: Discuss your understanding of the principle of linear regression and its use as a trading indicator and show how it is calculated?
Understanding Linear Regression, and use as a technical Indicator
Linear regression statistically indicates the relationship between dependent variables (x), and independent variables(y) plotted on a graph. That is the dependent variable is used to do predictive analysis to give an outcome to the independent variable. For instance, it can be used to quantify the impact of time (dependent variable) on the price (independent variable) movement of a particular asset.
That said, the linear regression indicator came about from the principle of linear regression. This indicator is used to analyze the market by traders to understand the relationship between price, and time. This indicator is helpful in that traders can determine when to exit a trade, and when to enter a trade. LRI could be nicknamed “forecaster” as it forecast the price of an asset tomorrow, and plotted today.
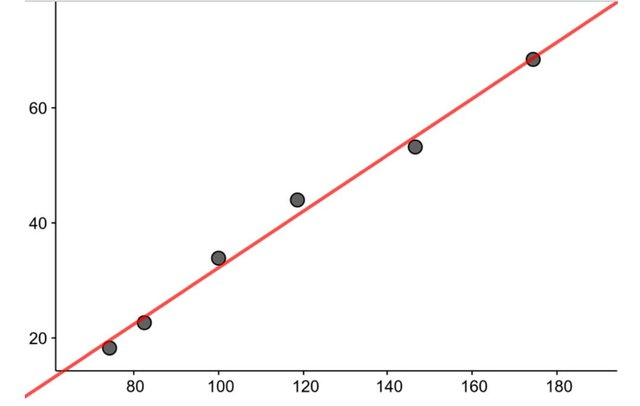 Source
Picture 1 Linear regression line
It has a default period of 14 days but can be adjusted from the settings by a trader to suit your choice. The variables are plotted as points on the chart, and a line is drawn to show the relationship between the variables. This indicator gives trade signals such as resistance level, reversals, and support trends.
Calculations in Linear Regression Indicator
It is calculated using the following formulae:
Y = a + bX
Whereby the following is considered:
a= ([y-b [x)/n
b=n[(xy)-([x)([y)/n[x² - ([x)²
x = current period of time
n = chosen number of time periods.
y = value of LRI you wish to calculate.
Question 2: Show how to add the indicator to the graph, How to configure the linear regression indicator, and is it advisable to change its default settings? (Screenshot required)
How to Add LRI to the Chart
I am going to use tradingview.com to show how to add the LRI to the graph. While on the site, I go to the homepage and open the chart icon. Select a pair of assets of your choice.
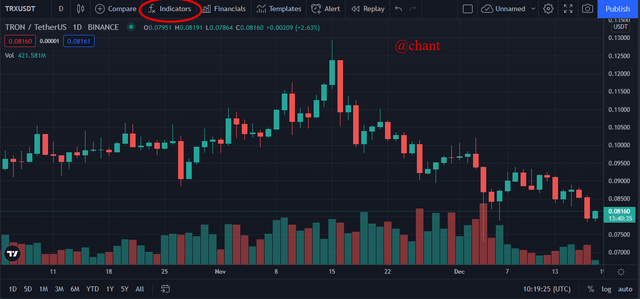
Picture 2: screenshot is taken from trading view
Proceed, and click on the fx indicator, and a search bar will appear. Input regression, and click on linear regression formula as indicated in the screenshot below.
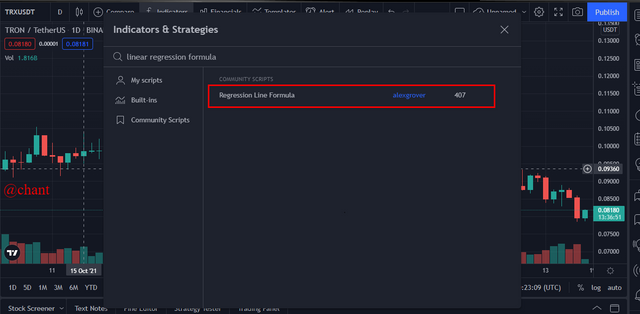
Picture 3: screenshot taken from trading view
Once I select the linear regression formula, the LRI is added to the chart.
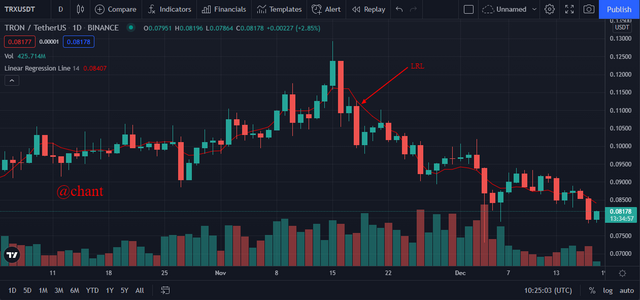
Picture 4: screenshot is taken from trading view
Configuring LRI
To configure LRI, I click on the Settings icon beside the linear regression line on the chart.
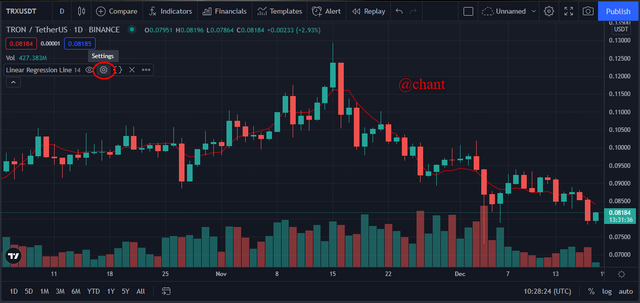
Picture 5: screenshot is taken from trading view
Once I click on the settings icon, it takes me to the settings page. The default period is 14days under “input” but can be adjusted by the trader.
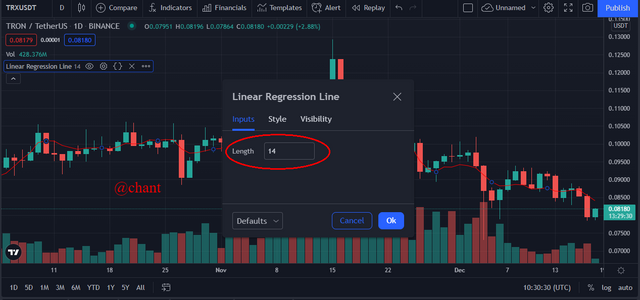
Picture 6: screenshot is taken from trading view
I continued, and click on the “style” icon which enables me to select line color and increase the thickness of the line, and click on “ok”.
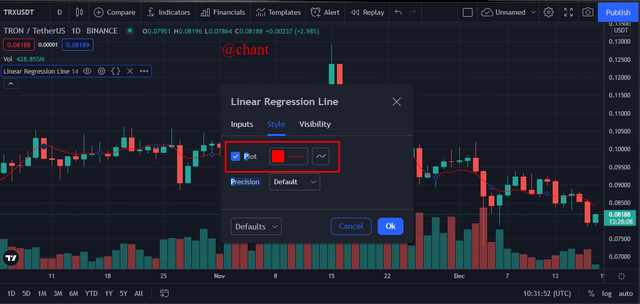
picture 7: screenshot is taken from trading view
Changing the default settings all depends on the trader's strategy. Default settings do not make an indicator to be precise or useful. One of the basic rules of the way indicators work is that when settings are long, it increases the sensitivity of price changes, and when set to a shorter period, it decreases the sensitivity of price changes, thereby allowing more price fluctuations to be filtered.
Therefore, changing indicators default settings depend on whether the trader strategy is for short-term or long-term trading.
Question 3: How does this indicator allow us to highlight the direction of a trend and identify any signs of a change in the trend itself? (Screenshot required)
Highlighting Trend Directions Using LRI
The linear regression line is vital in identifying the movement of trends. The linear regression line kind of determine trends. For instance, when the line is moving in an upward direction, a bullish trend will be identified, and when the linear line is moving downward, a bearish trend is identified.
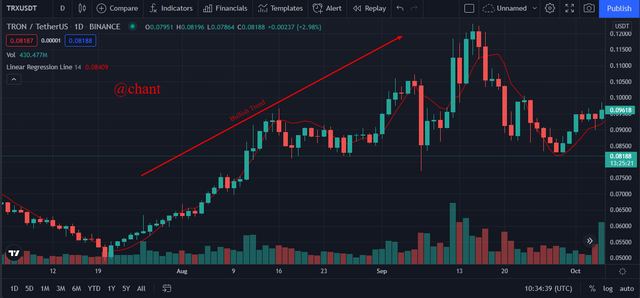
Picture bullish trend: screenshot is taken from trading view
Looking at the chart above, we see that as the linear regression line is moving upward, as price equally moves high, indicating a bullish position.
With regards to the bearish trend, the linear regression line moves downward, while the price equally decreases.
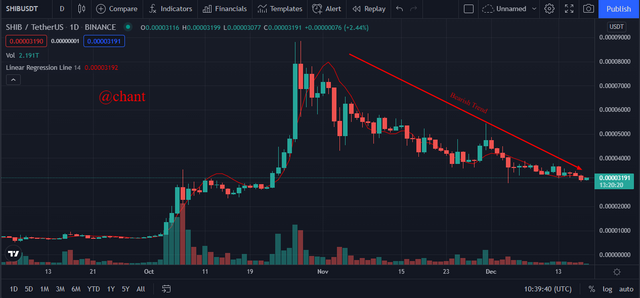
Picture bearish trend: screenshot is taken from trading view
A reversal trend can be identified during bullish or bearish trends when the price moves below or above and crosses the linear regression line. When price moves above and crosses over the linear regression line, a bullish reversal signal is identified, and traders start looking forward to selling. But when the price moves below and crosses the linear regression line, there is a bearish reversal.
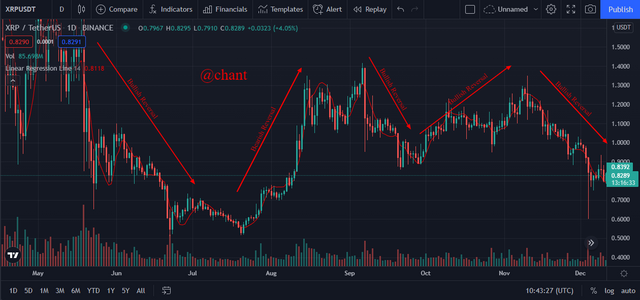
Picture Reversal Trend: screenshot is taken from trading view
Question 4: Based on the use of price crossing strategy with the indicator, how can one predict whether the trend will be bullish or bearish (screenshot required)
The price crossing strategy in LRI is to enable traders to identify trend signals. Price crossing strategy involves the movements of price and the linear regression line. They both determine whether a trend is moving downward, or upward positions.
To predict a bullish signal, when price moves upward and cuts across the linear regression line, a trader can predict a bullish trend. This indicates a strong buy signal.
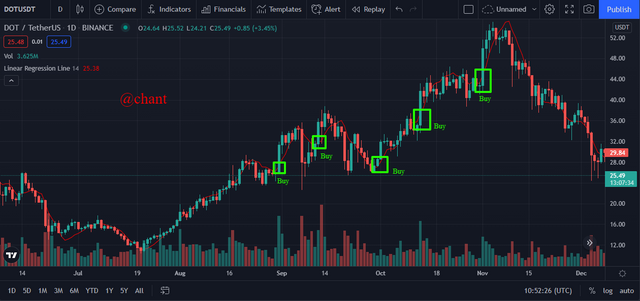
picture predicting the bullish trend: screenshot is taken from trading view
To predict the bearish market, the linear regression line moves downward and cuts across price candlestick. This indicates a strong sell signal for traders.
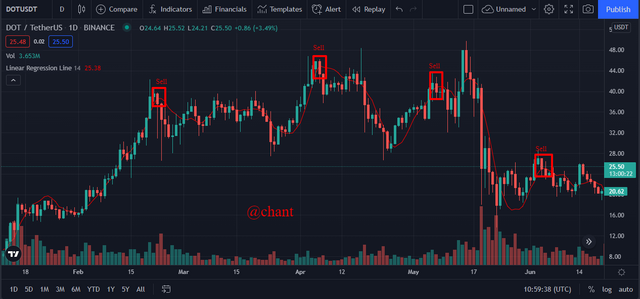
Picture predicting the bearish trend: screenshot is taken from trading view
Question 5: Explain how the moving average indicator helps strengthen the signals determined by the linear regression indicator. (screenshot required)
It is often good for traders to use more than one indicator to be able to determine good entry and exit positions in the market. LRI and MAI have similarities as they give out trade signals for traders to anticipate the future market.
However, LRI gives a lot of false signals as compared to MAI. Nevertheless, the use of MAI, helps traders to be able to identify false signals presented by the LRI. Therefore, I’m setting LRI for a longer period to be able to identify false signals, while the moving average will be set at a period of 20.
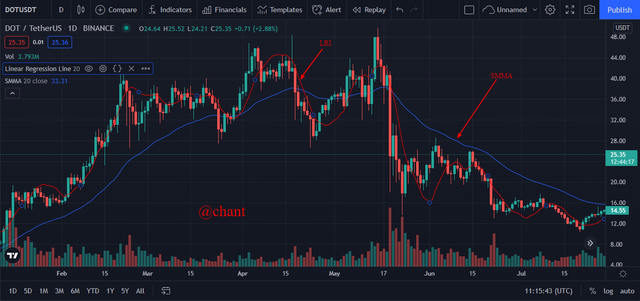
Picture of LRI and Moving Average Indicator
When there is an upward movement of price and cuts across the Linear regression line, and the moving average, there is bound to be a bullish trend position. While when the linear regression line, and moving average move downward and cut through price, a bearish trend is determined.
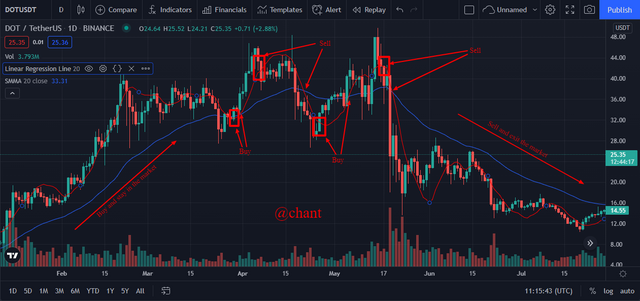
Picture bullish and bearish trend using both indicators
Question 6: Do you see the effectiveness of using the linear regression indicator in the style of CFD trading? Show the main differences between this indicator and the TSF indicator (screenshot required)
LRI indicator is one of those indicators used by traders in CFD trading due to its efficiency in determining prices in the crypto market. This indicator is good for long-term trading so that there is enough time to filter out false signals.
TSF is based on the analysis of linear regression and is suitable for short-term trading as it predicts future price movements. It does not create a straight linear regression trend line but rather plots the last point of multiple trend lines with linear regression.
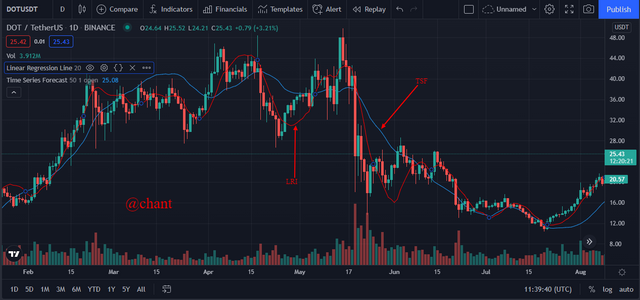
Picture of LRI and TSF: screenshot is taken from trading view
Both LRI and TSF are similar in function as they both predict the future of price movements, enabling traders to know when to enter the market, and when to exit the market.
Notwithstanding, one of the main differences between the two indicators I have noticed is that LRI, is suitable for long-term trading while TSF is suitable for short-term trading.
Question 7: List the advantages and disadvantages of the linear regression indicator:
Pros of LRI
- It is effective in predicting price movements in the future.
- It enables traders to make informed decisions after doing analysis.
- It is easier to interpret, and understand the relationship between time, and price movements.
- It is easy to eliminate false signals by using other indicators, and determining entry, and exit points in the market.
Cons of LRI
- It gives false signals, especially when used in short-term trading.
- It is not effective in a highly volatile market.
Conclusion
Linear regression indicator is of importance to traders to analyze the market to better understand the relationship between time and price. From the above presentation, we see that LRI determines price trend to either upward, downward, or in a reversal way.
However, it is not advisable to hold only to LRI to determine price movements as false signals might be recorded. Therefore, it is recommended to use LRI with other indicators such as moving average indicator or TSF indicator to eliminate false signals.