
1.) Show your understanding of the SuperTrend as a trading indicator and how it is calculated?
SuperTrend Indicator was invented by Olivier Seban, which can work with all time frames starting from one minute. SuperTrend has proven to be an effective and easiest trading strategy to use working much better than moving averages and MACD. As the name suggests, it is a trend-following indicator that works well in upward and downwards trending markets. The SuperTrend Indicator is plotted on the price, and the current trend can be gotten from its placements. The SuperTrend Indicator is based on two parameters, which are the default parameters 10 periods for Average True Range(ATR) and a multiplier(3). ATR is used to compute the value as it plays a key role in SuperTrend and signals the price volatility for day traders.
A SuperTrend Indicator is a perfect tool to predict buy and sell signals on a chart as the indicator is plotted either on top or below the closing price. In simple terms, when the SuperTrend Indicator crosses over the price, a buy signal is generated, and a sell signal is generated when the Supertrend crosses below the price. During the overlaid and slipping of the indicator, the color of the indicator changes. When the buy signal is generated, the indicator turns green in color(SuperTrend below the closing price). The indicator turns red when a sell signal is generated and the SuperTrend is above the closing price.
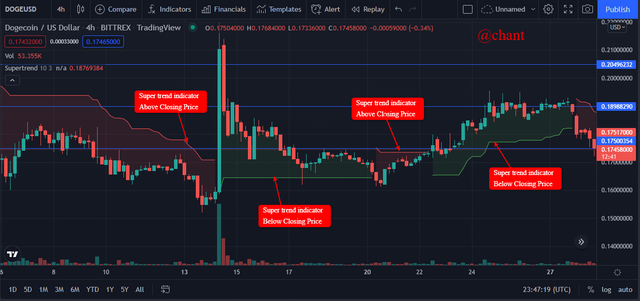 Screenshot from tradingview
SuperTrend Indicator is not different from other indicators, which can work at top best when combined with other indicators like MACD and RSI. SuperTrend Indicator is a great tool for a trader in an existing trade, as the indicator can be used as a support or resistance level to identify buy signals and vice versa.
With all the benefits of the SuperTrend Indicator for a trader, it is not a perfect tool to use during sideways markets as false signals can be generated. SuperTrend Indicators are not of best performance during volatile markets, so need for other indicators.
How is SuperTrend calculated
SuperTrend Indicator is used to predict trend directions to provide a buy or a sell signal for traders. And for a trader to identify an accurate signal, a combination of the average price rate of a period with a volatility indicator is vital. For the Supertrend indicator, the ATR indicator is used for the volatility indicator.
Calculate Values as per Formula
Basic UpperBand = (HIGH+LOW)/2 +Multiplier * ATR
Basic LowerBand = (HIGH+LOW)/2 -Multiplier * ATR
Calculation of Average True Range
[(Prior ATR x 13) + Current TR] / 14
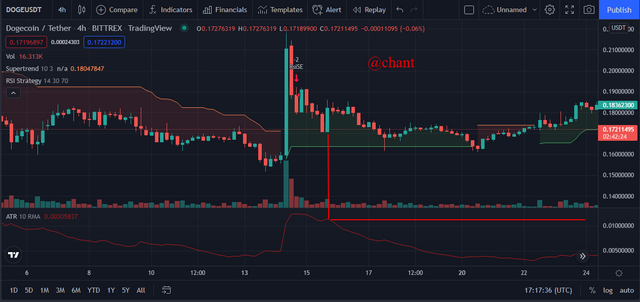
Illustration to calculate Green Line
 Screenshot from tradingview
From the highlighted candle stick on the image above,
high = 0.18326214
Low 0.17119541
ATR(10 Period) = 0.01105930
Multiply = 3
Supertrend Lower line = ( High + Low) / 2 - Multiplier × ATR.
( 0.18326214 + 0.17119541)
------------------------------- - (3 x 0.01105930)
2
0.26885985 - 0.0331779
= 0.23568195
2.) What are the main parameters of the Supertrend indicator and How to configure them and is it advisable to change its default settings? (Screenshot required)
The two main parameters of the SuperTrend Indicator are the ATR(Average True Range) and the Multiplier.
Average True Range (ATR)
To have the value for the ATR, a series of TR is calculated and the value is divided by the number of periods. A simple illustration is showed below.
Current high - current low
Current high - previous close
Current low - previous close
So the TR value is gotten by applying the formula above., As I mention, the Average for all the TR will be the value used to divide by the period to have the ATR
Current ATR = ((Prior ATR x 13) + Current TR) / 14.
Multipliers
The Supertrend indicator gets its final value after the ATR has been multiplied by the multiplier, the default multiplier is 3 can be changed depending on the trader's strategy.
How to configure SuperTrend Indicator
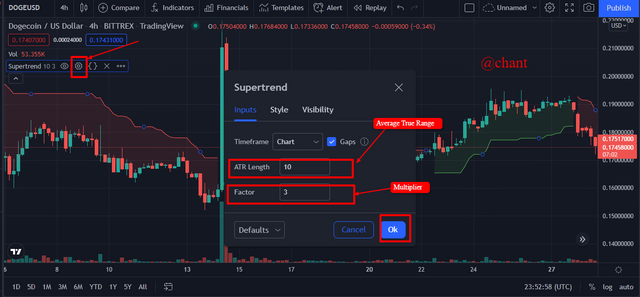
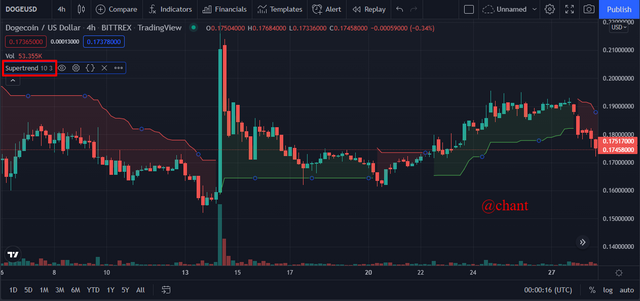
Configuring the Supertrend indicator is as simple as adding another indicator to a chart as illustrated in previous courses.
 Screenshot from tradingview
 Screenshot from tradingview
The default setting is 10 periods and a multiplier of 3.
Is it advisable to change its default settings?
Changing the default setting is by altering the 10 periods and multiplier(3) as shown on the default configuration above. Altering the setting is all about the trader's strategy, as smaller ATR value will bring up more signals and more price change actions. For the bigger values of ATR, most of the noise made by the price actions will be eliminated and a few signals show up on the chart.
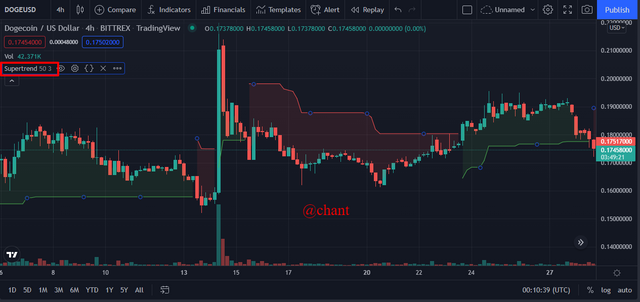 Screenshot from tradingview
From the image above, a large ATR value strategy can be a perfect tool for a long-term treader and vice versa. It will come down to the trader strategy of sticking to the default value or altering for trade.
3.) Based on the use of the SuperTend indicator, how can one predict whether the trend will be bullish or bearish (screenshot required)
The first thing to note here is that price is the main determinant factor of trend movements on charts. The use of the SuperTrend Indicator facilitates the work of traders to easily predict bullish or bearish signals of an asset. It is a good indicator to be used by crypto traders as it permits them to know when to enter the market and buy or sell, and equally when to exit the market.
Predicting Bullish Trend with SuperTrend Indicator
To predict a bullish market, the SuperTrend Indicator line moves below the price line but in an upward trend. This movement should be experienced over a long period without recording any breakout. This implies that buyers are in control of the market. This could be seen on the chart below as the SuperTrend Indicator line moves below the price line but in an upward movement.
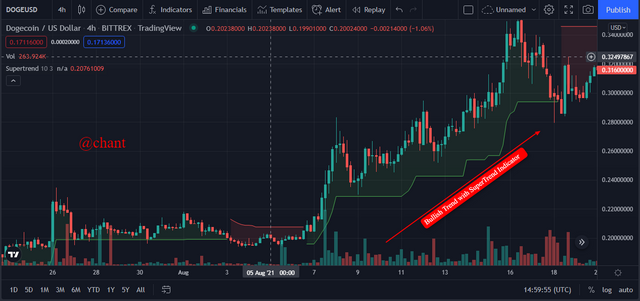 Screenshot from tradingview
From the chart above, we see how this indicator line moves below the price line in an upward movement over a longer period without any breakout that led traders to predict a bullish market.
Predicting Bearish Trend with Super trend Indicator
Here the indicator line moves above the price line in a downward direction. This usually occurs when sellers are in control of the crypto market of an asset. It should be observed over a longer period. This can be seen as identified in the screenshot below.
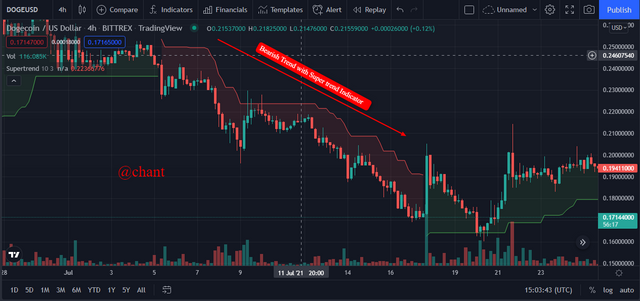 Screenshot from tradingview
From the image above, we realized that the SuperTrend Indicator line moves above the price line recorded over a longer period without recording any breakout results.
Notwithstanding, it should be noted that in a situation where there is a mix of both bearish, and bullish market trends, traders should not be in a haste to enter the market because false signals can be recorded over a shorter period.
4.) Explain how the Supertrend indicator is also used to understand sell/buy signals, by analyzing its different movements. (Screenshot required)
As I earlier mentioned, the SuperTrend Indicator is an easy way for traders to determine buy/sell signals of crypto assets in the market. For instance, a trader can spot out when to enter the market or when to exit the market based on the movements of the indicator line and the price line.
So, traders should expect to enter or exit the market when the price line moves above the SuperTrend Indicator line or when the price line moves below the SuperTrend Indicator line without breakout for a long period. This is usually identified by red or green lines on the chart after the opposite movements of the price line, and the indicator line. The changes in colors of the indicator line are due to the movements of the SuperTrend line, and the price line. Here, traders can identify buy/sell signals.
To exit the market, traders should observe a breakout point when the SuperTrend Indicator moves above the price line. Here we noticed that the indicator line turns red on the chart. When this happens, traders should exit the market and wait for a possible reversal.
To determine the buy signal as I earlier mentioned, the indicator line moves below the price line in an upward movement, and this is represented by the green line. This can be seen as highlighted on the below screenshot.
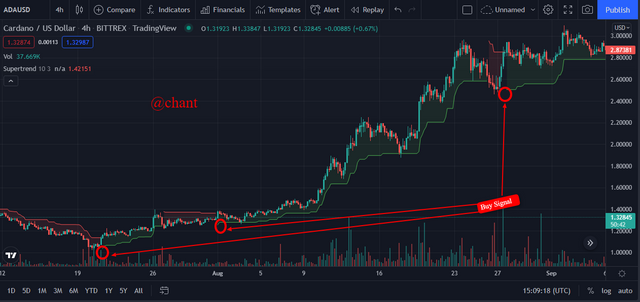 Screenshot from tradingview
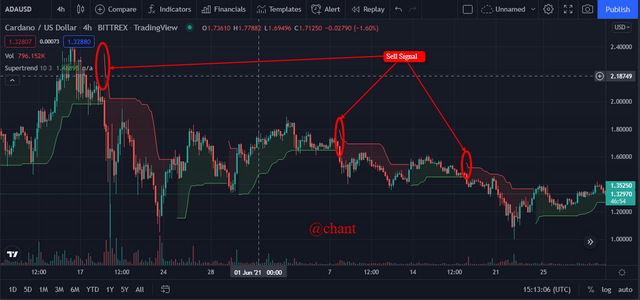
For the sell signal, the indicator line will turn red when it moves above the price line following a downward position of an asset. This can be seen as indicated on the below screenshot.
 Screenshot from tradingview
From the chart, we see that it is easy to identify the sell signal as the indicator line turns red. This happened when the red indicator line moved above the closing of a bearish trend.
5.) How can we determine breakout points using Supertrend and Donchian Channel indicators? Explain this based on clear examples. (Screenshot required)
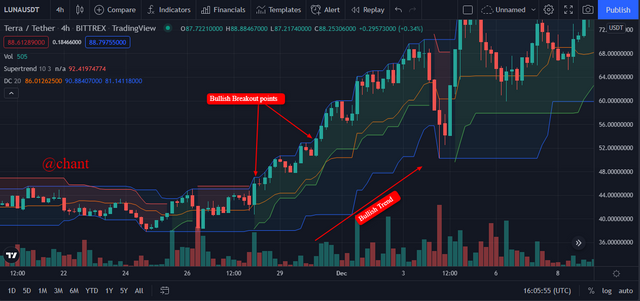
The determination of breakout points with a super trend indicator is usually done with the combination of the Donchian Channel. That is, the Donchian Channel helps to highlight lows and highs on the chart as price changes. This usually occurs over a longer period. This requires a lot of technical analysis, and traders need to be careful when trying to determine the breakouts positions.
That said, the SuperTrend Indicator function is to filter market trends while the Donchian Channel works to generate values when price moves from high to low over a particular period. To determine breakouts all depend on the trading strategy a trader chooses to know the number of periods to observe. I am going to use the 20 days period of the Donchian channel combined with a super trend indicator.
Before doing that we need to first consider the bearish and bullish market situations to determine the breakout points.
In a bullish breakout position, the SuperTrend Indicator line moves below the price line, and the SuperTrend Indicator line turns green. Now, the market is open for traders to buy but this should only be done after 2 consecutive candles are formed by the Donchian channel in an upward trend.
 Screenshot from tradingview
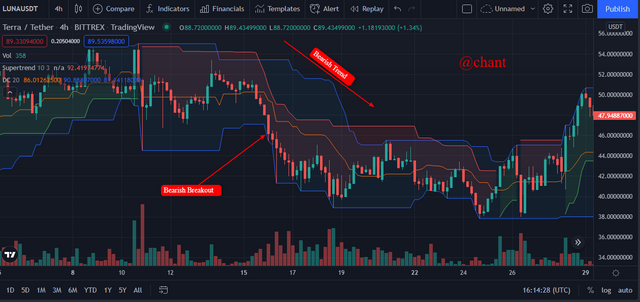
In a bearish market breakout, the SuperTrend Indicator line turns red after moving above the price line. Here the price is low and the price line breaks through the low lines of the Donchian channel. This is not enough for a trader to initiate a sell order of an asset but this could be confirmed by the trader when at least 2 consecutive candles are formed by the Donchian channel in downward movement. Here the trader can confirm a bearish breakout, and sell as indicated on the below screenshot.
Screenshot from tradingview
6.) Do you see the effectiveness of combining two SuperTrend indicators (fast and slow) in crypto trading? Explain this based on a clear example. (Screenshot required)
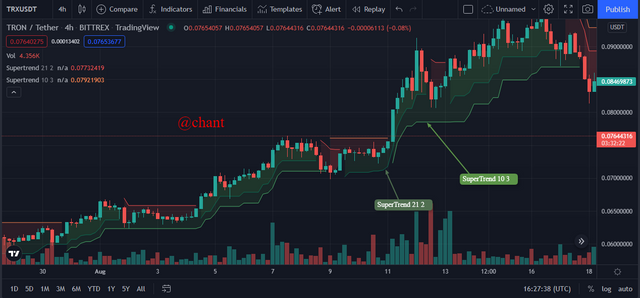
The SuperTrend Indicator like other indicators is good for technical analysis of the market by traders. Just like other indicators, it is often advisable to combine two different indicators to have a good market analysis. Therefore combining two different moving averages will help to give out a good analysis. Let’s take moving averages of 21, 2 as a fast super trend indicator, and add to a slow super trend indicator for instance 10,3. Here, a trader can confirm a buy signal when the moving fast curve crosses the slow curve. This gives a good buying market position for traders and the curves will turn green in color.
 Screenshot from tradingview
To confirm a sell market position, the fast-moving curve crosses below the slow-moving curve and turns red. This implies that the market is in a selling position as seen below on the screenshot. At this point, a trader can as well decide to exit the market.
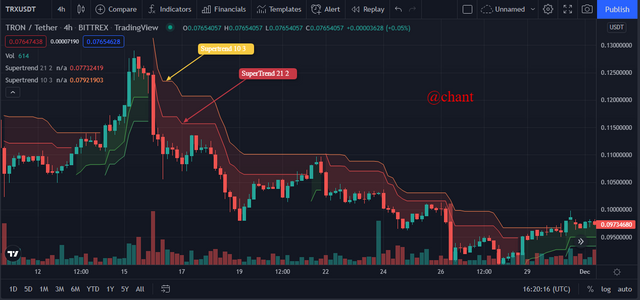 Screenshot from tradingview
7.) Is there a need to pair another indicator to make this indicator work better as a filter and help get rid of false signals? Use a graphic to support your answer. (screenshot required)
As I earlier made mention of the fact that using a single indicator is not advisable because a trader will not be able to come out with a good market analysis that will eliminate false market signals. Therefore it is good to combine two or more indicators based on the trading strategy used to filter good entry and exit points in the market.
Moreover, using more than one indicator will be beneficial for a trader as it will help to eliminate false market trends. This way, a trader will be able to identify when to buy and when to sell without making losses. However, not every indicator works well to give out good signals. Therefore, it is now left to a trader to detect which indicators best fit his or her trading strategy to have a good analysis.
That said, I will Combine the SuperTrend Indicator with Relative Strength Index (RSI]) Indicator to determine oversold, and overbought situations in the crypto market.
To determine the overbought market signal, the RSI is valued at 70 or above, and the line turns green. This implies that the asset was overvalued but can as well lead to a trend reversal. I'm in a situation of an oversold signal, RSI is valued at 30 or below, and the line turns red. Therefore, RSI shows if the asset was overbought or oversold.
Despite the above mentioned overbought, and oversold signal determined by RSI, a trader should not focus his or her analysis on this but rather use the SuperTrend Indicator to eliminate false signals. As I earlier mentioned, the determinant of signals on the SuperTrend Indicator is price movement. So, the SuperTrend Indicator will help to eliminate false market signals generated by the RSI, and the trader will be able to determine buy and sell signals.
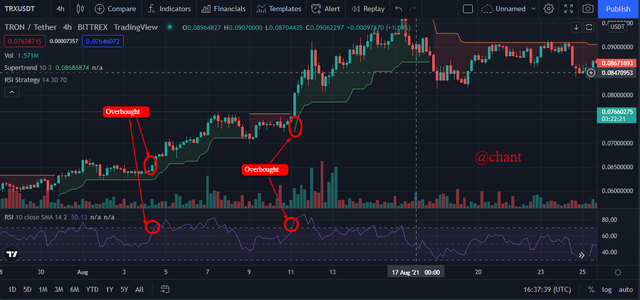 Screenshot from tradingview
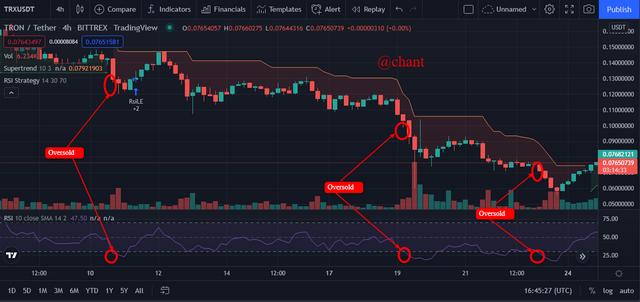 Screenshot from tradingview
8.) List the advantages and disadvantages of the Supertrend indicator
Many trading experts recommend the use of the SuperTrend Indicator due to its numerous advantages as listed below:
- It often gives out good market signals for traders to enter or exit the market.
- It gives out timely signals.
- It is free to use on trading platforms, unlike some indicators that require traders to buy premium products before they can access them.
- The indicator helps intraday traders with good technical analysis of the market trends.
- The indicator is easy to use by both beginner traders, and old traders.
- It helps traders to make timely decisions, and make profits.
Notwithstanding, experts recommend traders to combine the SuperTrend Indicator with other indicators such as the RSI mentioned above due to the following disadvantages recorded by the SuperTrend Indicator:
- This indicator does not work appropriately in all aspects as at times, it generates false market signals.
- It works well mostly in trending markets.
- The SuperTrend Indicator focuses on two frameworks of the multiplier and ATR. Any other condition makes this indicator predict inaccurate market results.
Conclusion
From the above analysis, it is clear that the SuperTrend Indicator was understood as an indicator that traders can use to determine market trends if bullish or bearish. I was able to configure the indicator on a chart which helps in market analysis to determine buy/sell positions.
We equally saw how it was advisable to combine the fast and slow super trend Indicators to come out with breakout points.
As a take-home message, I understood that using a single indicator such as SuperTrend Indicator, is not good because it might give out inaccurate results. This will lead to losses of traders' capital. Therefore, traders should choose other indicators that best fit their trading strategy to have accurate results in market analysis, and make profits.
Thanks, Professor @ kouba01 for
This week’s lecture is about the super trend indicator as I am now going to use it alongside the RSI to trade.