
What is the difference between Realized Cap & Market Cap, How do you calculate Realized Cap in UTXO accounting structures? Explain with examples?
Realized cap is the total number of unspent assets (UTXO) based on the prices they were last traded. It changes each time an unspent asset is traded. Therefore, when an asset is traded above the price it was lastly traded, realized capital increases. When traded at a price lower than the price lastly traded, realized capital decreases.
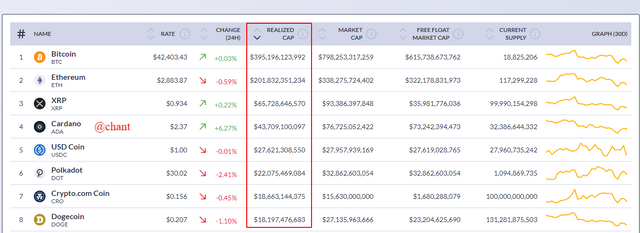 Screenshot Coinmetrics
Market cap is the total amount offered at the current price rate in the market. That is, the unit price is measured in terms of the market value. It is the current price of an asset multiplied by the circulating supply price. It is used by cryptocurrency traders to check the quality of an asset to make informed decisions.
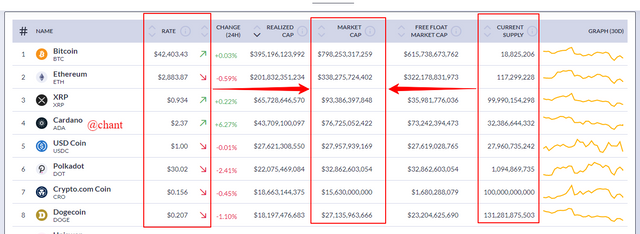 Screenshot Coinmetrics
Market cap enables traders to determine prices of assets, values, and compare them with circulating supply capital before trading. In the nutshell, it is used as a measuring tool by traders, and an important indicator that gives price signals.
To calculate the market cap, multiply the circulating supply of an asset by the current price of the asset. For instance, the circulating supply capital of Steem is 391,794,798, and the current price is $0.501.
Therefore, Market cap= Circulating Supply x Current Price.
Market cap= 391794798x0.501
= 196,289,194
Differences between Market cap, and Realized Cap
Market Cap indicates the total value of an asset in terms of unit cost, with the circulating supply value. Realized Cap shows the value of an asset taking into consideration the price that the asset was last traded.
Market Cap does not consider the price of assets lastly traded. Realized Cap considers the price of an asset lastly transacted.
Market Cap is calculated by simply multiplying the circulating supply capital by the current price of the asset. Meanwhile Realized Cap is calculated by multiplying UTXO with the creation price and summing up all UTXO with the creation price.
Market Cap has a high volatility rate, meaning that there are a lot of fluctuations with the values. Meanwhile Realized Cap has low volatility, meaning fluctuations are minimal.
How to Calculate Realized Cap in UTXO accounting Structure
Realized Cap= Value x Price (of all UTXOs)
Assume that Steem has 30 UTXOs, with a circulating supply of 30 steem. 10 steem has not moved since 2016, and the last time it was traded price was at $2. In 2018, 5 steem has not moved, and the last price traded was $2. In 2020, 5 steem has not moved, with the last price traded valued at $3. In 2021, 10steem has not moved, with the last price traded valued at $4.
Realized Cap= (10x2) + (5x2) + (5x3) + (10x4)
= 20+10+15+40
Realized Cap of Steem= $85.
(2) Consider the on-chain metrics-- Realized Cap, Market Cap, MVRV Ratio, etc, from any reliable source(Santiment, Glassnode, etc), and create a fundamental analysis model for any UTXO based crypto, e.g. BTC, LTC [create a model for both short-term(up to 3 months) & long-term(more than a year) & compare] and determine the price trend/predict the market (or correlate the data with the price trend)w.r.t. the on-chain metrics? Examples/Analysis/Screenshot?
Here I will be looking at the Realized Cap, Market Cap, MVRV Ratio on on-chain metrics using the Santiment web platform. My analysis will be based on the UTXO for BTC.
Realized Cap / Price Chart
On the charts below, we have a green color line(price) and a color pitch( Realized Cap line).
Realized Cap (Short-term)
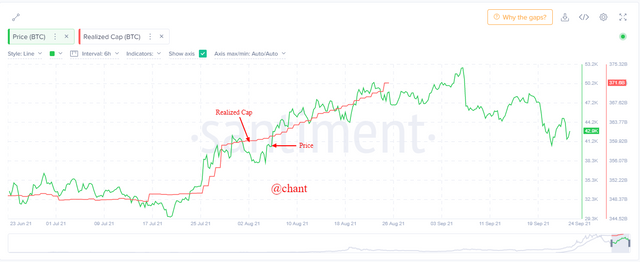 Screenshot Santiment
As the price moves up, the realized cap moves up too. If the price starts falling, the realized cap starts taking a semi straight-line position. At this point, a treader can start anticipating a buying position in the market.
Realized Cap (Long-term)
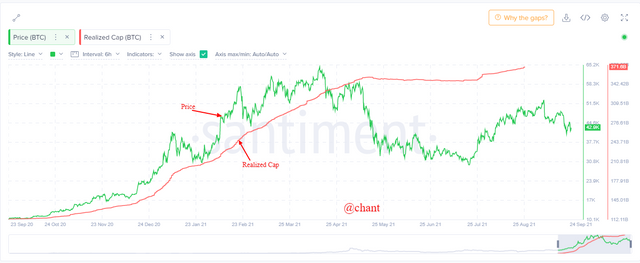
Analysis on the long term, we can see the same illustration as in the short term. When the price is moving up, the Realized cap is in the same direction. Note when the price is rising, the realized cap line is found below the price line. The moment the price starts falling, the realized cap crosses above the price line. At this point, an investor can start anticipating a buying position in the market.
Market Cap
On the charts below, we have a green color(price), and the color purple(Market Cap) line.
Market Cap (Short-term)
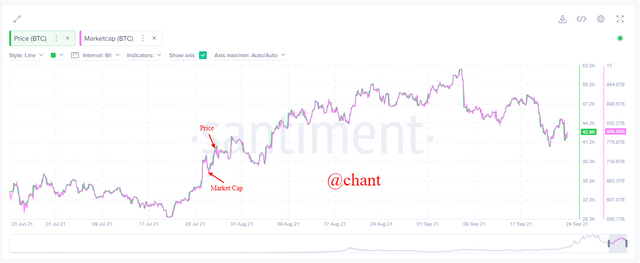 Screenshot Santiment
Both the price line and market cap line are moving almost on the same, and it is difficult to read which indicator is above the other. When the market cap moves price level, an investor can anticipate a selling signal in the market.
Market Cap (Long-term)
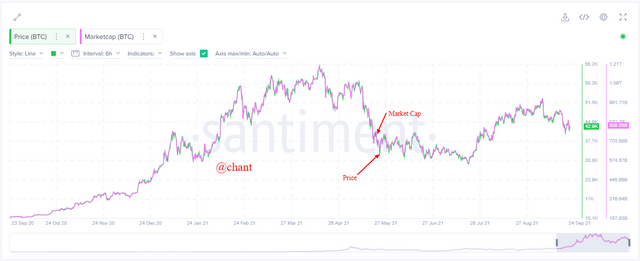 Screenshot Santiment
Analyzing a long-term chart, it is visible to pick the different indicators and possibly miss out on false signals in the market. As I mentioned above, a trader can start anticipating a buying position when the market cap crosses over the price level.
MVRV Ratio
On the charts below, we have a green color line which is the price, and the color orange which is the Market Cap line.
MVRV Ratio (Short-term)
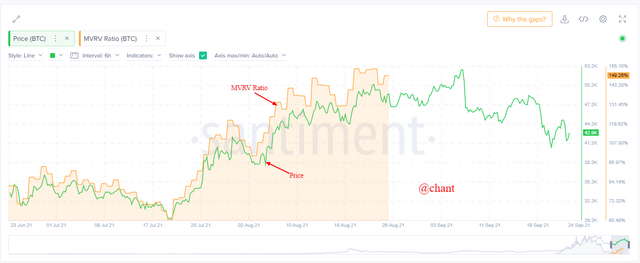 Screenshot Santiment
MVRV Ratio is a good indicator used to anticipate a future trend in the market, and it is always seemingly ahead of the price. It is usually above the price line when the market is in a bullish trend and a possible selling signal. So if the MVRV ratio crosses below the price line, possible bearish signal and time to think of buying.
MVRV Ratio (Long-term)
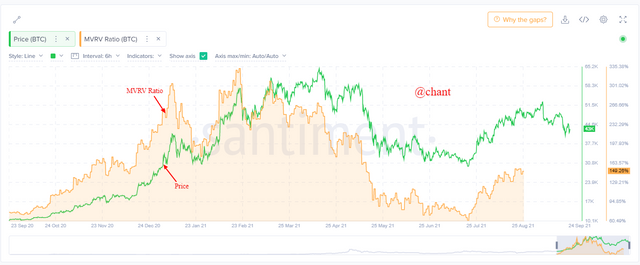 Screenshot Santiment
With the long, we can see when the market is in a bullish or bearish trend. We can see the MVRV ratio above the price line, and the market is in an upward trend. At this point, an investor can decide to sell or HODL to sell at a higher point. The moment the MVRV ratio crosses below the price line, the market starts experiencing a possible and finally a downward trend. Now, investors will start anticipating buying positions since it is advisable to buy at a low point.
(3) Is MVRV ratio useful in predict a trend and take a position? How reliable are the upper threshold and lower threshold of the MVRV ratio and what does it signify? Under what condition the Realized cap will produce a steep downtrend? Explain with Examples/Screenshot?
Is MVRV ratio useful in predicting a trend and take a position?
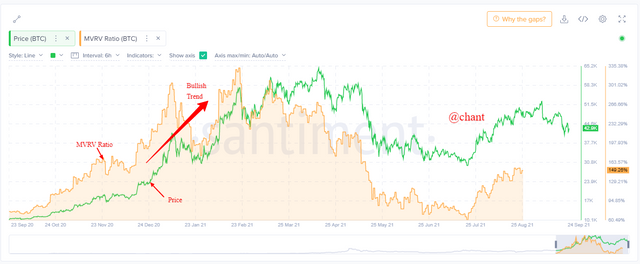
MVRV ratio is seemingly ahead of the price and can be a tool when anticipating a future trend following the interaction. Price is the factor that affects the decision of buyers and sellers in the market, as many will buy at low and sell at high points. Every trader wants to take back profit, with the MVRV ratio, it is complicated to know when to enter or exit a market. When the MVRV ratio is above the price level, it indicates a sign to sell, and when the MVRV ratio goes below the price, it indicates a signal to buy.
 Screenshot Santiment
In the above image, the chart shows that in a long-term position the MVRV ratio is above the Price level. From the analysis, a trader will be pushed to exit the market. Meanwhile, the price is rising, so he will have to stay in the market and make more profit in the market which is in an upward(bullish) trend.
 Screenshot Santiment
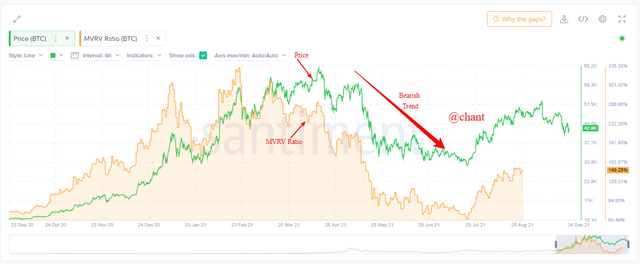
Here is another situation on the chart, we can see the MVRV ratio below the price level. We will be expecting investors to buy, but that will be a wrong signal from the analysis of the chart. We can see the price continually falling with the MVRV ratio below the price level(Bearish Trend). To make use of an MVRV ratio, a long-term position is a good option to minimize losses in the market.
How reliable are the upper threshold and lower threshold of the MVRV ratio, and what does it signify?
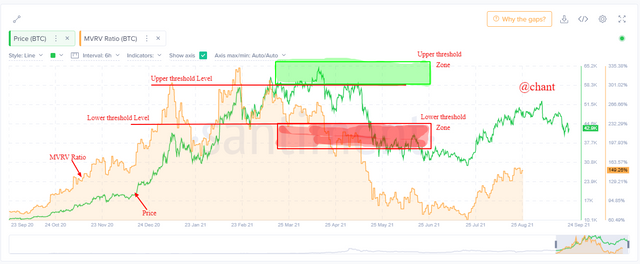
Reading the MVRV ratio, using the upper threshold and lower threshold level are reliable tools to apply to take profits and reduce losses in the market. The Upper Threshold can be seen as a resistance level, while the Lower Threshold is the support level. Just as we can sell when our market price hint passes resistance level to profit, same as when applying upper threshold and likewise anticipate a buy option when market price hint passes support level which is the lower threshold.
 Screenshot Santiment
Under what condition the Realized cap will produce a steep downtrend?
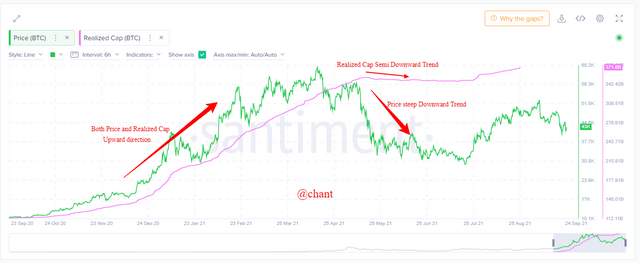
Realized cap produces a steep downtrend, which will mean the market price will have to be in a continued downtrend in a long-term position. The movement of Realized cap, be it in an upward trend or downward trend is cost by the movement of the market price. The movement in price in the market is determined by how investors buy and sell a coin. The more UTXO movements can create a steep downward trend Realized cap if the coin in question has been sold out.
 Screenshot Santiment
In the image above, the market price moves up, the Realized cap is producing a steep upward trend. As soon as the market price starts falling, the Realized cap turns to take a straight-line position. Producing a steep downtrend, I will think a continued steep downward trend in market price might result in that.
Conclusion
In sum, realized cap gives value of the circulating supply of an asset. It’s focus is on unspent coins. MVRV ratio is one of the best indicators used by traders to determine long term trading of both lower threshold, and upper threshold. Both realized cap, market cap, and MVRV are important determinants of price.
Thanks professor @sapwood for impacting us with knowledge. It was a pleasure participating in the task as it has widen my scope on crypto trading.