image by imarkup
Question 1
Define Heikin-Ashi Technique in your own words.
The Heikin-Ashi technique is used by specialized traders to pinpoint a given trend more easily.
We understand that a typical Japanese candlesticks doesn't use the data on the candle before the price of a candle is measured. It can be deducted that there is no apparent direct connection between the candles. But in the case of these Heikin-Ashi candles, they are counted and are represented by the information of the previous candle. In order to represent the next candle, it views the open, close, high and low prices of the former candle. In fact, it uses the mean data of the former candle opening, closing, high and low price And also, it is based on two-period mean.
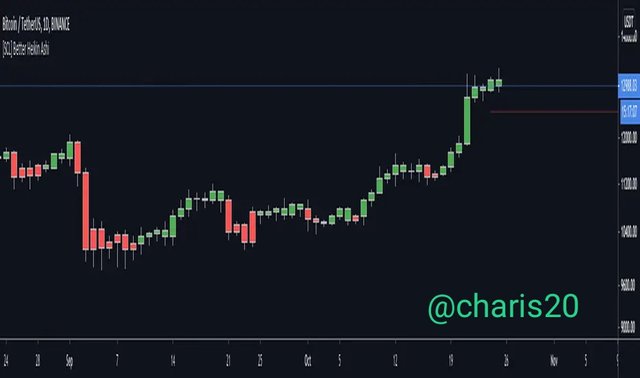
Image from trading view.com
Question 2
Make your own research and differentiate between the traditional candlestick chart and the Heikin-Ashi chart. (Screenshots required from both chart patterns)
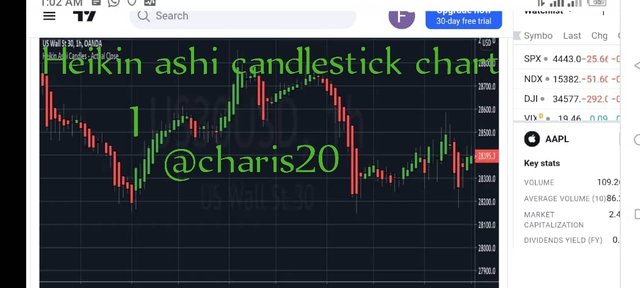
Chat 1Image from trading view.com
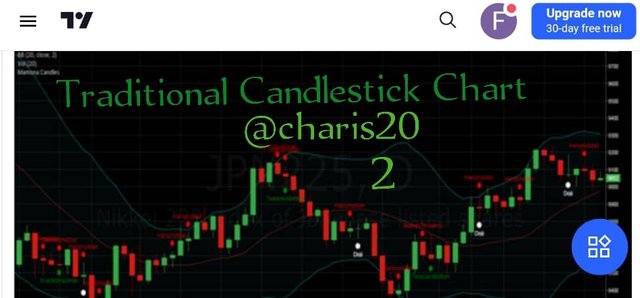
Chat 2 image from trading view.com
As you can see from the chart 2 is the traditional Japanese candlestick chart, and the chat 1 is the Heikin Ashi chart.
With reference from the chart 1, the graph are smooth in a way that is found in the traditional candlesticks chart 2.
The graph on traditional candlestick charts often change from green to red (up or down) which can make them hard to interpret.
While on the order hand candles on the Heikin Ashi chart brings more sequential colored candles, which helps traders to distinguish past price movements easily.
Heikin Ashi charts have an aptness for its candles to remain green during an uptrend and remain red during a downtrend.
This is not so compared to traditional Japanese candlesticks that interweave color even if the price is moving strongly in one direction.
Candlesticks are produced by calculation in heikin ashi charts but the new candle starts from the level where the previous candle closed in traditional chart.
Question 3
Explain the Heikin-Ashi Formula. (In addition to simply stating the formula, you should provide a clear explanation about the calculation)
Heikin Ashi formula is like a traditional Japanese candlestick aside from that the open and close are measured otherwise.
Similar to a normal traditional candlesticks, each Heikin Ashi candle has an open, close, high, and low. This is to say that there are four constituents of Heikiin Aishi formula:
The open of a Heikin Ashi candlestick is similar to the middle point or average of the prior candle.
Every new candlestick begins from the midpoint of the prior one.
OPEN= [(Open price of prior candle) + (Close price of prior candle)] divided by 2.
The close of each Heikin Ashi bar is similar to the midpoint value between the four constituents: open, close, high, and low:
CLOSE= (Open + High + Low + Close) divided by 4.
The high of a Heikin Ashi bar takes the actual high of the period. This might be the highest shadow, the open, or the close. Vice versa.
HIGH= Maximum Price Reached.
The LOW of a Heikin Ashi candlestick carries the real low of the period. This might be the lowest shadow, the open, or the close.
Low = Minimum Price attained.
The univeral idea in the Heikin Ashi candlesticks is that they facilitate or smooth the price action.
In recap, Heikin Ashi formula;
HIGH = Maximum of High, whether Open, or Close.
LOW = Minimum of Low, whether Open, or Close.
OPEN = [Open (previous bar) + Close (previous bar)] divided by 2.
CLOSE = (Open + High + Low + Close) divided by 4.
Question 4
Graphically explain trends and buying opportunities through Heikin-Ashi Candles. (Screenshots required)
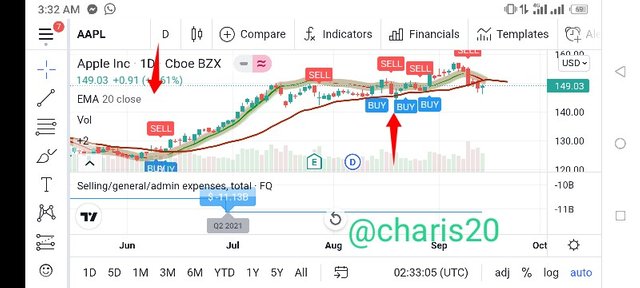
There is an aptness Heikin-Ashi for the candles to remain red through a downtrend and green throughout an uptrend, as long as normal candlesticks mingle the color even if the price is moving leading in one direction. It actually becomes most efficient certifying signals pinpoint by more technical analysis.
Heikin Ashi charts can be employed in the same way as any other chart, for finding chart.
The green candles with no lower shadow denotes a strong uptrend. I.e Green candles signify an uptrend.
Candles with a small body bounded by upper and lower shadows denotes a trend change so as risk-loving traders might buy or sell here, but others will wait for a proof before entering Red candles signifies a downtrend: You might want to add to your short position and exit.
Red candles with no high shadows shows a strong downtrend: Stay short until the trending revamps.
A long cavity Heikin-Ashi candlestick signifies strong buying pressure over a two day period. The lack of a lower shadow also mirror's strength.
Small Heikin-Ashi candlesticks, or those with long upper and lower umbra show indecision over the last two days. This most at times occurs when one candlestick is filled and the other has cavity.This gives the chart a smoother mien, making it easier to visualize trends and reversals, but also darks gaps and some price data.
Question 5
Is it possible to transact only with signals received using the Heikin-Ashi Technique? Explain the reasons for your answer
I will blatantly say NO. Simple because Heikin Ashi technique is not the most perfect technique or 100% in crypto currency exchange.
Owing to the volatility of the market, using only one indicator is not good.
In order to survive in the market, other techniques must be applied to cushion the effect of any change.
Therefore combined techniques is vital for trading for management of risk and other factors.
Question 6
By using a Demo account, perform both Buy and Sell orders using Heikin-Ashi+ 55 EMA+21 EMA
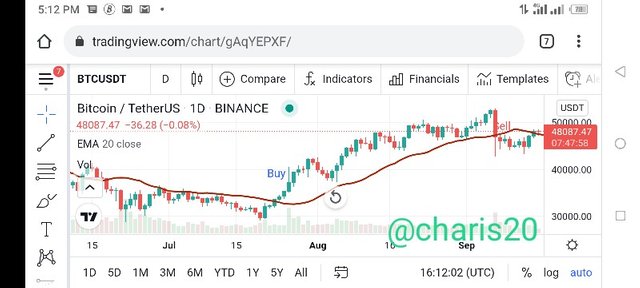
Image trading view.com
From the chart it shows that BTC was bought at $35,000 and sold at $48,087 and take profit at $13,087.
It's gonna be a great transaction
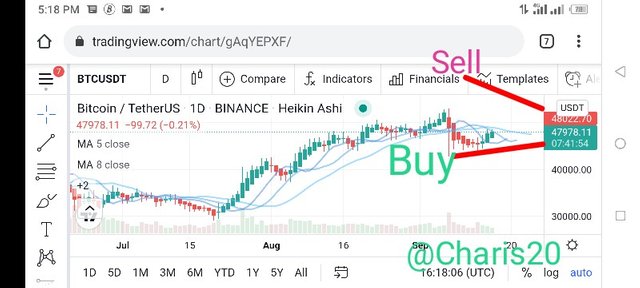
Image from trading view.com
CONCLUSION
Heikin Ashi technique is not an absolute signal other indicator must be incorporated for effective transaction.
I thank God for participating in this week's class.
Thanks
@charis20
Downvoting a post can decrease pending rewards and make it less visible. Common reasons:
Submit