
I designed this image on Canva.
Introduction.
I am excited to once again be a part of professor @fredquantum's class. This week prof's lecture is on crypto trading with the TRIMA indicator. Prof has taught what the TRIMA indicator is, how it is added to crypto charts, how its used to identify uptrends and downtrends and using it with other indicators for better trading results.
I would now like to present my work on the task given.

What Is Your Understanding Of The TRIMA Indicator?
Moving averages are very important aspects of the technical indicators we use. Moving averages are trend based indicators as they help traders identify trends of assets and are primarily of 3 types. These are Simple Moving Averages (SMA), Exponential Moving Averages (EMA) and Weighted Moving Averages (WMA).
The TRIMA indicator, Triangular Moving Average is an advanced form of the simple moving average which has been smoothened to work better and give better results. The SMA indicator works by taking the averaging prices of assets during a specific period of time. Because of this, the SMA responds quickly to price changes and as a result can give false signals.
The TRIMA indicator was developed as doubly smoothed to take the double average prices of assets over a period of time and help predict the direction of prices. TRIMA unlike SMA does not react quickly to price changes as a way to prevent false signals. However, this has resulted in the indicator giving late signals.
Because the TRIMA indicator has been made to use the double average of prices, the indicator gives clear trend formations although they can sometimes be late. TRIMA filters the noise out of the market n an attempt to remove false signals and deliver right signals.
Although the TRIMA indicator has its advantages, it undoubtedly has disadvantages and as such is not a perfect indicator. For better results it is advised we combine them with other indicators.

Setup A Crypto Chart With TRIMA. How Is The Calculation Of TRIMA Done? Give An Illustration.
Applying the TRIMA indicator to a crypto chart.
- Visit tradingview and click on charts.

- From the launched charts, select the crypto pair of choice. I selected the SOL/USDT pair.

- Click on indicators.
- Search for Triangular Moving Average and click on it from the results.

- Indicator is launched as shown.


Calculation of the TRIMA indicator.
The TRIMA indicator is an advanced form of the SMA indicator. Since its a double averaged indicator, the SMA is calculated first and the the average is taken.
Mathematically,
SMA = ( P1 + P2 +P3 + .... Pn ) / n
where,
P = price of asset,
n = number of periods,
Pn = price of asset at last period
P1-5 = price of asset over 3 periods.
Therefore,
TRIMA = ( SMA1 + SMA2 + SMA3 ... + SMAn ) / n

Identify Uptrend And Downtrend Market Conditions Using TRIMA On Separate Charts.
Uptrends And The TRIMA Indicator.
Identifying uptrends with the TRIMA indicator is quite easy to achieve. Generally, the asset has to be in uptrend while the prices create price highs, new price highs and higher highs. When using the TRIMA indicator to identify uptrends, the prices of the assets have to be above the the TRIMA indicator.

From the chart above, we see that the prices of are above the TRIMA indicator telling us the asset is in uptrend.

Downtrends And The TRIMA Indicator.
Identifying downtrends with the TRIMA indicator is also quite easy to achieve. Generally, the asset has to be in downtrend while the prices create price lows, new price lows and lower lows. When using the TRIMA indicator to identify downtrends, the prices of the assets have to be below the the TRIMA indicator.

From the chart above, we see that the prices of are below the TRIMA indicator telling us the asset is in downtrend.

With Your knowledge Of Dynamic Support And Resistance, Show TRIMA Acting Like One. And Show TRIMA Movement In A Consolidating Market.
The TRIMA indicator not only helps traders identify support and resistance levels but also helps traders identify dynamic support and dynamic resistances.
Support and resistance are horizontal unlike dynamic support and resistance that is diagonal. Support and resistance levels are price ranges of assets where there's so much trading pressure ( either buying or selling ). They can help traders identify possible trend reversals and good trading opportunities.
Dynamic Support and The TRIMA Indicator.
Dynamic supports can be seen during uptrends. During uptrends, the asset's price finds and breaks the support on the TRIMA indicator. After this indicator and there's a price retest, the price goes back to its original trend and continues to form new support levels.

From the chart above, I have indicated various supports in the chart which is in an uptrend showing the dynamic support.

Dynamic Resistance and The TRIMA Indicator.
Dynamic resistance can be seen during downtrends. During downtrends, the asset's price finds and breaks the resistance on the TRIMA indicator. After this indication and there's a price retest, the price goes back to its original trend and continues to form new resistance levels.

From the chart above, I have indicated various resistances in the chart which is in a downtrend showing the dynamic resistance.

Consolidating Market And The TRIMA Indicator.
A consolidating is a non trending market which means that there is no trend direction of the asset during a particular period. In consolidating market, the price keeps bouncing off the support and resistance.
During consolidating or ranging or sideways markets, the prices are within the TRIMA indicator and are neither above nor below the TRIMA indicator.

From the chart above, I have indicated the TRIMA indicator in a consolidating market. We can see that the prices at the point I have indicated are in between the TRIMA indicator.

Combine Two TRIMAs And Indicate How To Identify Buy/Sell Positions Through Crossovers. Note: Use Another Period Combination Other Than The One Used In The Lecture, Explain Your Choice Of The Period.
For the purpose of this task, I would be using a short TRIMA indicator with period 9 and a longer TRIMA indicator with period 25. These 2 would help me analyze the charts through their crossovers in identifying the buy and sell signals. I am also choosing these 3 periods because they will help in the scalp trading approach I want to use.
Buy Scenario Using The TRIMA Indicator Crossover.
A good entry for a buy trade is indicated when the shorter TRIMA indicator crosses above the longer TRIMA indicator. In this case, a buy trade is seen when the 9 TRIMA crosses above the 25 TRIMA.
When this occurs, there's indication of a trend reversal from downtrend or bearish to uptrend or bullish. Since this is risky like other trades, proper trade management should be used to avoid unnecessary risks.

From the chart above, the asset is in an uptrend. We can see at the point I have indicated and marked as a buy entry is the point at which the 9 TRIMA indicator crosses above the 25 TRIMA indicator.

Sell Scenario Using The TRIMA Indicator Crossover.
A good entry for a sell trade is indicated when the longer TRIMA indicator crosses above the shorter TRIMA indicator. In this case, a sell trade is seen when the 25 TRIMA crosses above the 9TRIMA.
When this occurs, there's indication of a trend reversal from uptrend or bullish to downtrend or bearish. Since this is risky like other trades, proper trade management should be used to avoid unnecessary risks.
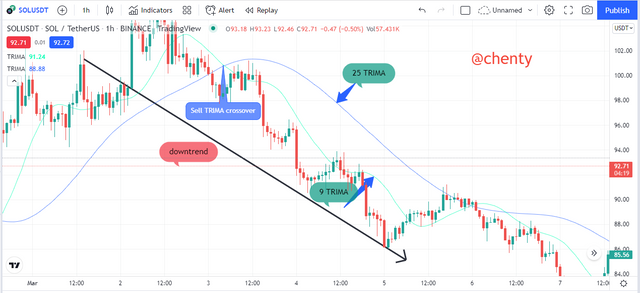
From the chart above, the asset is in a downtrend. We can see at the point I have indicated and marked as a sell entry is the point at which the 25TRIMA indicator crosses above the 9 TRIMA indicator.

What Are The Conditions That Must Be Satisfied To Trade Reversals Using TRIMA Combining RSI? Show The Chart Analysis. What Other Momentum Indicators Can Be Used To Confirm TRIMA crossovers? Show Examples On The Chart.
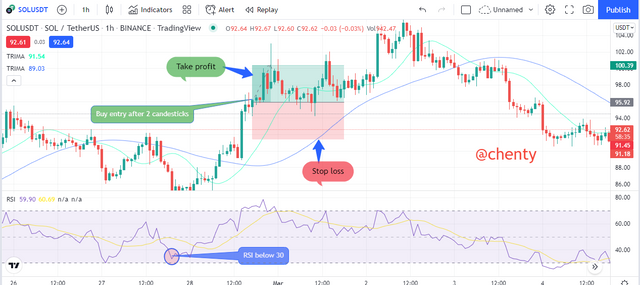
Conditions For Trading Bullish Reversal With TRIMA And RSI Indicators.
Add 2 TRIMA indicators. One with a shorter period and the other should be of a higher period.
Add the RSI indicator.
Using the RSI indicator, the level should be in the oversold region which is below 30 level. This should be observed in a downtrend since we're looking for a bullish reversal.
Using the TRIMA indicator, the shorter TRIMA should cross above the longer TRIMA.
When both conditions are met, set trade after 2 or 3 candlestick confirmations.
With proper risk management, stop loss and take profit levels should be set. Preferably, risk : reward ratio should be 1:1 or 1:2.

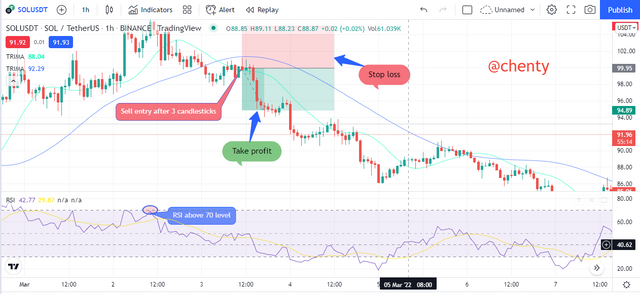
Conditions For Trading Bearish Reversal With TRIMA And RSI Indicators.
Add 2 TRIMA indicators. One with a shorter period and the other should be of a higher period.
Add the RSI indicator.
Using the RSI indicator, the level should be in the overbought region which is above 50 level or 70 level. This should be observed in a downtrend since we're looking for a bullish reversal.
Using the TRIMA indicator, the longer TRIMA should cross above the shorter TRIMA.
When both conditions are met, set trade after 2 or 3 candlestick confirmations.
With proper risk management, stop loss and take profit levels should be set. Preferably, risk : reward ratio should be 1:1 or 1:2.

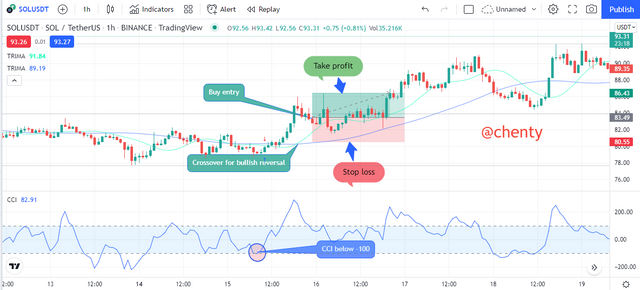
Using CCI Indicator To Confirm TRIMA Crossovers.
The CCI indicator, Commodity Channel Index is also a momentum based indicator that helps traders identify and determine trend reversals. It works almost in the same way as the RSI indicator but instead of using the 70 and 30 levels to identify overbought and oversold zones, it uses the 100 and -100 levels or bands.
Bullish Trend Reversal With TRIMA and CCI.
In a bullish reversal, the CCI indicator should be below the -100 in the oversold region. Then using the TRIMA indicator, the TRIMA with the lower period should cross above the TRIMA with the higher period. After 2 or 3 candle stick confirmations, the buy entry can be made. A risk : reward ratio of 1:1 or 1:2 can be used.

Bearish Trend Reversal With TRIMA and CCI.
In a bearish reversal, the CCI indicator should be above the +100 in the overbought region. Then using the TRIMA indicator, the TRIMA with the higher period should cross above the TRIMA with the lower period. After 2 or 3 candle stick confirmations, the sell entry can be made. A risk : reward ratio of 1:1 or 1:2 can be used.
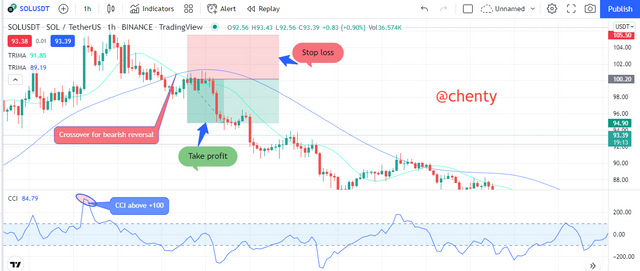

Place A Demo And Real Trade Using The TRIMA Reversal Trading Strategy (Combine RSI). Ideally, Bullish And Bearish Reversals. Utilize Lower Time Frames With Proper Risk Management.
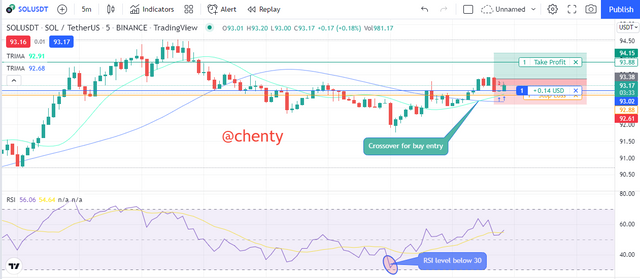
Buy Demo Trade Using TRIMA and RSI.
From the lecture, I have realized that when the RSI level is below 30 and the lower TRIMA crosses above the higher TRIMA, there's a buy signal. After I identified all these signals, I set my buy trade at $93.02. With risk management in mind, I decided to use 1:1 risk : reward ratio.

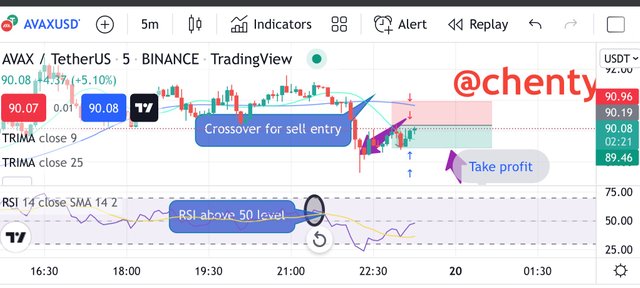
Real Trade Using TRIMA And RSI Indicator.
——
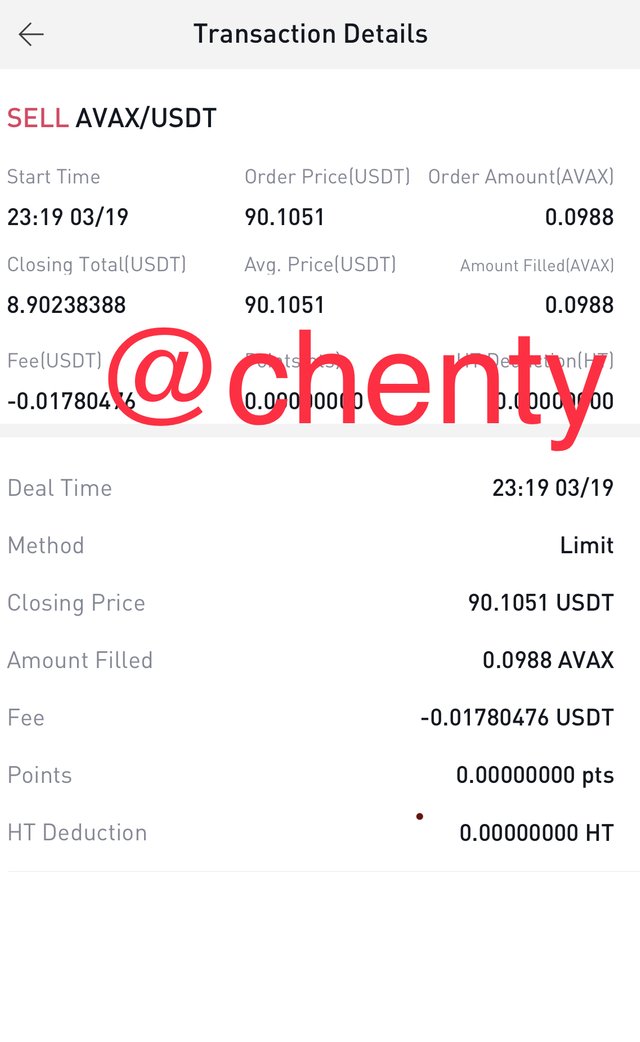
From the lecture, I have realized that when the RSI level is above 50 level and the higher TRIMA crosses above the lower TRIMA, there's a sell signal. After I identified all these signals, I set my sell trade at $90.1051. With risk management in mind, I decided to use 1:1 risk : reward ratio

What Are The Advantages And Disadvantages Of TRIMA Indicator?
Advantages of TRIMA indicator.
The TRIMA indicator helps filter noises from the market.
It's easy to identify trends with the TRIMA indicator.
Combining 2 TRIMA indicators of different periods can help identify trading opportunities.
Comparing TRIMA to SMA, TRIMA gives more accurate results.
TRIMA can serve as dynamic support and dynamic resistance.
Disadvantages of TRIMA indicator.
It cannot be used alone. For better results, it is better when it is combined with other indicators like RSI.
The TRIMA indicator can be a lagging indicator since it doesn't respond quickly to price changes.

Conclusion.
I must say a big thank you to professor @fredquantum for this very informative lecture on crypto trading with the TRIMA indicator.
The TRIMA indicator is a trend based indicator that helps traders identify and determine trends. The TRIMA indicator is an advanced form of the SMA indicator that works by doubly averaging prices and doubling smoothening price changes.
The TRIMA indicator because of how it works is a lagging indicator but does not really give false signals since it doesn't respond quickly to price changes.
With the crossover strategy, 2 TRIMAs of higher and lower periods can be used to identify trading signals. When the lower TRIMA crosses above the higher TRIMA, it's an indication of a buy signal buy when the higher TRIMA crosses above the lower TRIMA, it's an indication of a sell signal.
Thank you.
Upvoted! Thank you for supporting witness @jswit.

Downvoting a post can decrease pending rewards and make it less visible. Common reasons:
Submit