Introduction.

Image designed by me on Snappa
I am very excited to be a part of professor @imagen's class again this week. This week we have been introduced to fundamental and technical analysis, the Japanese candle stick and the Fibonacci retracements.
I would now like to present y solution t the task given.

Fundamental And Technical Analysis.
As cryptocurrency enthusiasts and potential investors, there are over 1000 cryptocurrencies we can choose to invest in. However due to how highly volatile the crypto world is and the potential of coins to either reward you with huge profits or make your invest almost void in the twinkle of eye, it is important to analyze whatever token you choose to invest in before you do. The analysis done on the cryptocurrency to earn huge profits and avoid scams is fundamental and technical analysis.

What Is Fundamental Analysis?
Fundamental analysis is the type of analysis that deals with understanding or analyzing the information on an asset like the blockchain asset's aim, its use cases, team behind it, users, potential scams and as well if they are being backed by any of the very popular "big" people.
Fundamental analysis is done primarily to determine if an asset is a good investment opportunity by identifying if the asset has been undervalued and overvalued or oversold and overbought. Identifying these undervalued or overvalued positions helps investors to try to acquire the best possible entry and exit positions. An asset is undervalued if its current price is lower than its expected price and overvalued if its current price exceeds its expected price.
Due to the nature of cryptocurrencies, there is no best time to enter or exit a trade but with proper fundamental analysis an investor can have a better chance of entering or exiting a trade.
To get the best out of fundamental analysis, there are certain characteristics or categories to consider when analyzing an asset. These include; On-chain metrics, project analysis and metric analysis.
On-chain metrics is fundamental analysis that involves studying information provided by the asset's blockchain. This information can be obtained from the blockchain's official website or on exchanges like binance and as well, websites for live coin price tracking like coinmarket cap. On-chain analysis involves transaction count where we identify the number of transactions the blockchain has carried out since its introduction, transaction value where the total value of the total transactions carried out is determined, active addresses where the addresses of the total transactions is carefully analyzed to ensure that it isn't just 1 investor transferring tokens back and forth and the blockchain's sender's and receiver's addresses that have been used over a certain period.
It also involves identifying fees paid where fees paid can be used to identify the demand for an asset, hash rate where the level of security is determined and amount of staked assets to identify the willingness of users to partake in blockchain activities like governance and block validation.Financial metrics is the fundamental analysis used to determine the asset's market capitalization where the value of the asset is determined and how much it would cost to buy every available unit of the asset, liquidity which indicates how easily it would take for an asset to be bought or sold, trading volume which indicates how much value of the asset has been bought and sold and as well determine liquidity. Market cap can be determined by multiplying the circulating supply of the asset by its current price value.
Maximum supply is also a financial metric which allows investors to know if an asset is intended to have a limited supply or not. BTC has a limited supply of 21 million coins aimed to be reached in 2140 and doge coins claims to have its coins in infinity. So if you are an investor who doesn't want to invest in a token of limited supply, identifying the max supply would be useful.
Total supply too is a financial metric that allows us to know the total number of the asset in existence.Project Analysis is the final category of financial analysis that analysis the progress of the project. Here, the whitepaper which involves the detailed information about the blockchain is read. The whitepaper has detailed information and explanation on the technology used, the blockchain's use cases, it's intended future and road map and as well its distribution method for its tokens. The team of the project is studied to identify the expertise of the blockchain's project and to see if any member of the team has been involved in a fail project or crypto scam. The competition of the blockchain's projects with others should be scrutinized as well where users would see if what the project offers is more beneficial than what its other numerous blockchain competitors offer.
It is also important to identify how it's initial tokens were distributed to determine if a bulk of its tokens is owned by a small number of people. If a few people own a bulk of the tokens, it is risky because they can control the market of the asset and make the token a shit coin when they withdraw all their assets. How the future tokens intend to be distributed should be identified as well.

Importance Of Fundamental Analysis.
Protects investors from scams.
Used to help investors avoid projects that can be manipulated by a number of people.
Used to identify the future of an asset.
Used to identify total supply, maximum supply and circulating supply of assets.
Used to determine the intrinsic value of an asset and how much it is undervalued or overvalued.

What Is Technical Analysis?
Technical analysis the type of analysis where traders make use of technical indicators, historical charts and patterns to study the trend or future trend of an asset. It is generally used to determine if an asset would be in an uptrend or a downtrend.
Technical analysis was first introduced in the 1800 by Charles Dow and is now widely used with the aid of technical tools / indicators to identify various price patterns. Technical analysis range from easy to very complex analysis that sometimes has something to do with the choice of indicators.
It deals with identifying support and resistance levels, market breakouts, trend reversals, price changes, etc which all have something to do with the patterns the charts of assets form. Generally, every market is controlled by supply and demand and the crypto market is no different. Supply and demand has something to do with human behavior or emotions and the kind of emotion investors portray during a certain period influences the trend the market is in.
If the investors are in greed, the market is in uptrend which can be measured by an indicator called the fear and greed index. Technical analysts also use patterns to do their analysis. They include the sharkfin patterns, amongst others.
Other analyses types include determining the strength of a trend where indicators like the ADJ are used. Technical analysis is done to determine if this trend strength can be continued.
Technical analysts believe that history repeats itself and that is why technical analysis is done by analyzing historical data and charts. It is also believed that the market moves in trends and so these patterns and indicators designed for use are based on market trends.
Although technical analysis is considered to give clearer predictions of future trends of prices, the indicators used are not 100% correct and so analysts are often advised to use 2 or more indicators in coordination with each other. RSI work best with bolligner bands and the SMA indicator works best with the stochastic indicator.
I have made mention of patterns quite a number of times. A pattern is identified in a cryptocurrency chart when there's a line that connects common price points over a certain period. The sharkfin pattern is normally a regular or inverted V shape pattern when which occurs when there's a sharp reversal in market trend.
One very important feature used in technical analysis is trend lines. Trend lines are drawn mainly to indicate an uptrend or downtrend market. An uptrend is characterized with an upward line drawn in the chart and a downtrend is characterized with a downward line drawn.
Technical analysis goes hand in hand with technical indicators which I have mentioned severally. These technical indicators have been built and developed in cryptocurrency trading websites like tradingview. Tradingview is the most popular trading website that houses a lot of built in technical indicators to aid in technical analysis and fundamental analysis.
The Japanese candlestick can be used to perform analysis like identifying support and resistance levels and more advanced indicators like RSI, bolligner bands, ADJ indicators are used for more complex analysis.

Importance Of Technical Analysis.
Technical analysis can be used on many time frames.
Technical analysis provides all the current information of an asset.
Technical analysis provides analysts with tools for identifying price trends.
Because of the use of historical data, similar patterns in the current market can be identified and used to make profits.

Differences Between Technical And Fundamental Analysis.
| Fundamental Analysis | Technical Analysis |
|---|---|
| Fundamental analysis does not rely on too many assumptions | Technical analysis is based on too many assumptions |
| Based on return on equity and assets | Based on the dow theory |
| Used to identify intrinsic value of assets; undervalued or overvalued assets | Used to determine the right time to enter or exit a trade. |
| Usually for longer term investments | Usually used for short term investments |
| Uses news, reports and information from very prominent people | Relies on charts |
| Fundamental analysis is more time consuming | Technical analysis is less time consuming |
| Easier to use by those that can read and write | Has too many technicalities and not easier to use |
| Used to analyze an asset based on its expected or fair value | Used to predict the future price of assets |

Which One Is Used More Often?
Fundamental analysis is used more often than technical analysis.

Solana ( SOL ) And The Fundamental Analysis Indicating The Objective Of The Project, Financial Metrics And On- Chain Metrics.
The Solana blockchain launched in 2017 is an open source project that runs on a blockchain with the aim of providing DeFi services by promoting the creation of DApps. Solana was introduced to solve the scalability problems associated with the pre existing blockchains and to achieve this it runs on the Proof of History consensus algorithm (PoH) that works together with the Proof of Stake consensus algorithm (PoS).
Anatoly Yakovenko founded the Solana blockchain and created the PoH that has solved scalability issues. Solana blockchain boasts of the blockchain with the fastest transactions completing 1000 transactions per second at very low fees for as low as $0.00025.
Like already stated, the Solana blockchain runs on the combination of the PoH and PoS consensus mechanisms which are responsible for the blockchain' security. PoH executes large transactions and PoS is used to validate blocks produced by the PoH.
Solana blockchain has over 400 projects which all have the main objective of providing very fast transactions at low fees and providing better DeFi services by promoting Dapp creation.
The native token of Solana is SOL which the blockchain uses for its transactions and activities.
Solana's financial metrics deals with quantifying the blockchain's asset value (SOL). This involves the market capitalization, trading volume, liquidity, maximum supply, total supply and circulating supply.
As at the time of writing, according to coinmarketcap SOL had a price value of $199.78, market capitalization of $60,099,163,707, 24hr trading volume of $6,211,458,159.70, maximum supply is not given, total supply of 507,163,961 coins, circulating supply of 300,824,026.87 SOL , market rank #6 and a market dominance of 2.38%.


The on chain metrics analysis involves total transaction count , transaction value of the total value of the total transactions carried out, active addresses of the total transactions and the blockchain's sender's and receiver's addresses. It also involves identifying fees paid for an asset and hash rates.
The on chain metrics can be obtained from the official website of the blockchain. Here the on chain analysis was given from solana.
According to the official website of solana, as at the time of writing, the total transactions was 34,928,378,485, a circulating supply of 300.8M, an active stake of 397.6M, and a SOL price of $194.45.

The total validators were 1,122, weighed skip rate of 4.1%, normal staking APY of 7.74%, and block numbers and their hashes with their validators are displayed. SOL had a non-circulating supply of 206,339,993 SOL and a total supply of 507,163,653 SOL.

From the graph shown, it shows that SOL has been on an upward trend over the past few weeks.

Purchase Of SOL Of Least 10 USD From By Verified Huobi Account.
- Login to huobi pro account.

- Select spot trading and click on exchange.

- From the opened exchange page, type sol in the search box at the top left corner and click on SOL/USDT pair.

- Scroll to the buy and sell section at the bottom of the page. At the buy sol section, select market and enter the amount of sol to exchange and click on buy sol. I entered 11 USDT and clicked on buy sol.

- Since it was a market order it immediately got executed and I received 0.05 SOL worth 10.97 USD.


SOL is now an asset I own.

Applying Fibonacci Retracements To Solana (SOL) With A 4-hour Time Frame On The Tradingview Observing Its Price Evolution At 24 and 48 Hours.
Login to tradingview account and select the SOL/USDT pair to apply the fibonacci retracement tool.
The fibonacci retracement tool is an application of the golden ratio and is a tool that provides support and resistance levels of an asset. The way this indicator works is that when the value of an asset moves up or down, the price will "retrace" some portions of the previous trend before it corrects to the other direction. This retracement and returning of prices to its other or "right" direction forms the fibonacci levels at 0%, 23.6, 38.2%, 61.8%, 78.6 and 100%.
For better results with the fibonacci retracement tool, it is advised to use it over longer timeframes rather than shorter ones. When using the fibonacci tool, the drawing is done based on the trend of the asset. In an uptrend, you draw the line from bottom of chart but if in a downtrend, you draw from top of chart down the chart.
An upward trend is seen when the 1 or 100% fibonacci level of the fibonacci retracement tool corresponds to the lowest price of an asset and the highest price corresponds to the 0 point of the fibonacci retracement.
The fibonacci tool forms supports and resistance lines with the support level usually forming at the 50% retracement levels.
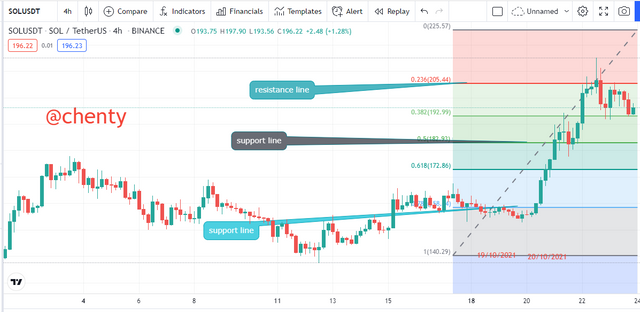
Using the screenshot above of the SOL/USDT pair with a 4 hour time and a 24 hour date range from 19th October 2021 to 20th October 2021, the SOL is noticed to be in an uptrend at an initial support at 0.786 level valued at $158.4. During that period at around 8am, that support broke and formed a new support at the 50% retracement level valued at $182.93. This new support line can be considered as SOL's new resistance.
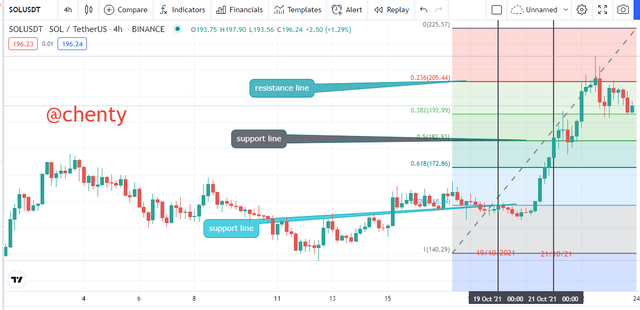
Using this next screenshot above of the SOL/USDT pair with a 4 hour time and a 48 hour date range from 19th October to 21st October, the SOL is still in an uptrend. The support line is $183.43 at around 12 pm and resistance was $205.76 at the end of the day.

Bollinger Bands And How They Apply To Crypto Technical Analysis. Which Other Tool Or Indicator Do You Combine Bollinger Bands To Analyze A Crypto.
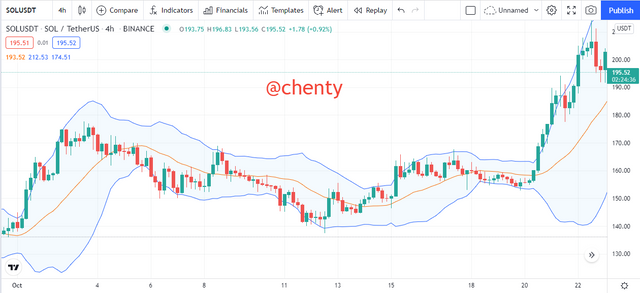
The bolligner band indicator added to a chart comprises of three lines; upper line, lower line and a middle line. The middle line of bollinger bands is a moving average that can be configurated by the investor or trader which has effects on the positioning of the two other moving averages (upper and lower lines). The upper and the lower lines which owe their positioning to the middle line is used to determine the strength of an asset. Using this indicator can help traders get a idea of "near right entry" and "near exits points".
An asset's uptrend or bullish run is indicated when you notice that there is a continuous up rise of the candlesticks towards the upper line or band. The green indicator usually indicates the asset's bull run when it is rising toward the upper band.
The asset's downtrend or bearish run is indicated when you notice that there a continuous or consistent fall of the candlesticks towards the lower line or band. The red indicator usually is the one that indicates the downtrend when the red candlestick is towards the lower band.
Like already stated in my explanation of the technical indicators, no one indicator is 100% correct and the bollinger bands indicator isn't any different. The reason for this is that the bollinger bands is slow to price changes or fluctuations.
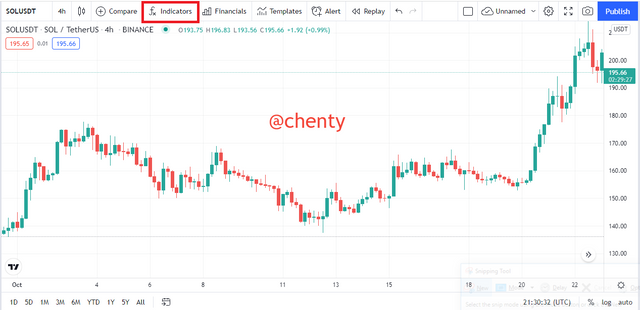
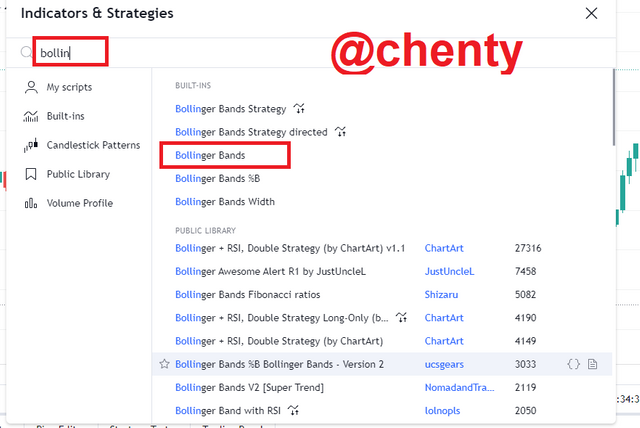
To add this indicator on a chart on a trading platform like tradingview, you click on the fx at the top of the page and type bollinger bands. Click on it and it is applied to the chard. It has its default settings and this is sometimes a problem because to apply them to real time trades, you will need to take more time to develop a more appropriate timeframe.
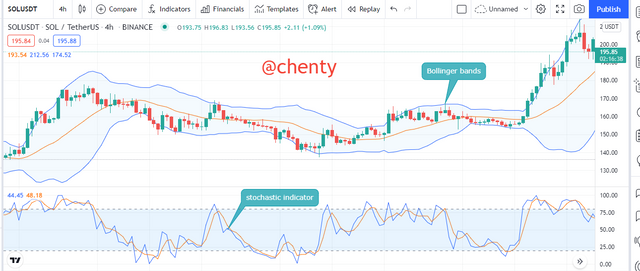
One indicator that can be used in cunjunction with the bollinger bands indicator is the stochastic indicator.
The stochastic indicator has been taught by one of the professors and which is an indicator that can be used to show an asset's overbought and oversold zones. The stochastic indicator consists of lines; Kand L lines. By default, the K line is blue and the L is orange.
The stochastic indicator is read within ranges between 0 and 100. When the indicator is above 80, it indicates an overbought zone and when it is below the 20 range, it indicates an oversold zone.
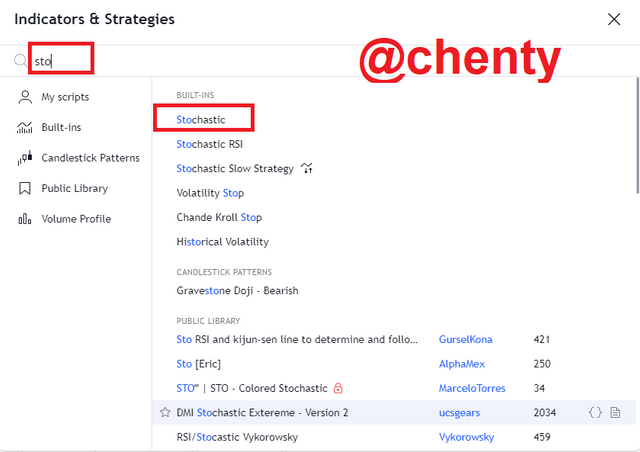
To add this indicator on a chart in tradingview, click on the fx and type stoch in the search box. Click on stochastic indicator to apply.

Conclusion.
I must say a very thank you to professor @imagen for this very informative lecture on principles of crypto analysis.
Fundamental analysis is used by long term investors to determine if a token is a good investment opportunity whilst the technical analysis is used to by short term investors to determine future price of assets. Fundamental analysis is based on on-chain analysis, project analysis and financial metrices which are used to determine the market cap, the objective of the blockchain and it's future.
Technical analysis is used by technical analysts with technical tools to analyze the charts of assets to determine their entry, exit points and future of the assets. Using either of the 2 cannot give you 100% and so it is better to combine both analysis methods to get the best chance of predicting the movements of assets.
Thank you.
Yes, it always better to analyze when to get entry and exit before trading with crypto to avoid huge losses since crypto has always been volatile and one can't actually predict prices.
Thanks for your effort.
Downvoting a post can decrease pending rewards and make it less visible. Common reasons:
Submit
Yes indeed. And applying this analysis methods can go a long way to helping us
Downvoting a post can decrease pending rewards and make it less visible. Common reasons:
Submit
Gracias por participar en la Cuarta Temporada de la Steemit Crypto Academy.
Continua esforzandote, espero seguir corrigiendo tus asignaciones.
Downvoting a post can decrease pending rewards and make it less visible. Common reasons:
Submit
Thank you for your review prof.
Downvoting a post can decrease pending rewards and make it less visible. Common reasons:
Submit
#club5050 😀
Downvoting a post can decrease pending rewards and make it less visible. Common reasons:
Submit