Hello everyone to the second week of steemit crypto academy season 3.
Introduction.
Image designed by me on Snappa
I must say I am very excited to be a part of this class because I have learnt something new.
For this class, we have been taken through some important charts.
I would now like to present my answers to the questions asked.

The Japanese Candlestick.
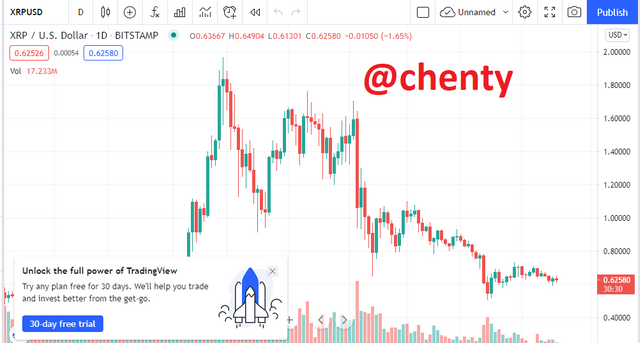
The Japanese Candlestick was invented by a rice trader called Munehisa Homma in the 1700s based on his understanding of supply and demand and that traders emotions influenced the market.
Although this method of price prediction was discovered by Homma, a book was published about this method in 1991 by Steve Nison.
This Japanese Candlestick method is used widely because it shows open, high, close and low price points in a market. These are four components of the Japanese Candlestick.
These 4 components help to analyse the price the market in a technical analysis where there are bullish and bearish trends.
These 4 components are usually diffentiated with colours set by traders to mark open and close points.
There is also shadow and real body. The real body is what is ugly represented with colours where as the shadow shows the price range of a market asset during a period.

Description of Any Other Two Types Of Charts.
Bar Chart.
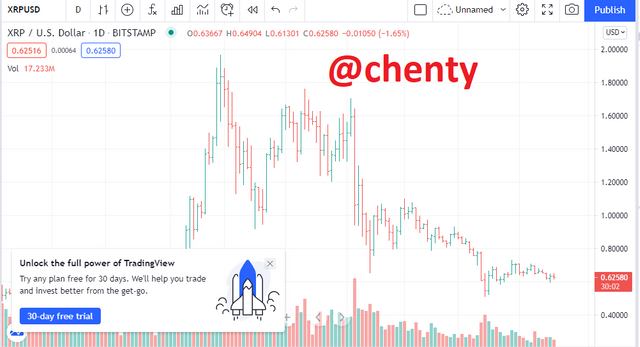
Bar charts are diagrams that make use of height of lines usually in rectangular form to represent values.
In the market, bar charts are used to represent high, low, close and open price movement.
In this chart, price is the y-axis ( vertical axis ) where as time is the x-axis ( horizontal axis ).
Each bar in the chart shows proce movement within a specified period of time.
Each bar in this chart shows the high and low price points.
Just like in the Japanese Candlestick, colours are used to help traders distinguish between price trends clearly where a green colour coming usually means uptrend or bullish trend and red means bearish or downtrend.

Line Charts.
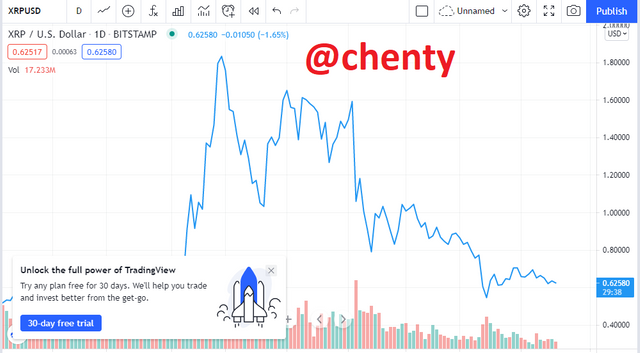
Line charts are simple and basic charts which mostly represent price changes on a daily basis.
There is a series of connected lines which do not follow a specific pattern because the market we deal with is very volatile.
This kind of chart is characterized by its method of showing only closing prices.
Line charts helps us to easily determine resistance and support levels for technical analysis.
They can also be useful in determining bullish and bearish market trends.
Line charts do not provide detailed information and are sometimes recommended for beginners who lack the knowledge to use more advanced charts.
They do not show high and low points as well as opening prices points.

Why Japanese Candlestick Is Mostly Used By Traders.
The Japanese Candlestick like I already said is a technical analysis tool that makes use of traders emotions analyzing opening, closing, high and low prices.
These charts are preferred because they show a trader, an assets high or low price, as well as its opening and closing price.
It can also be used to easily determine bearish and bullish trends.

Description of Bullish And Bearish Candles And Identifying Its Anatomy.
Bullish Candle.
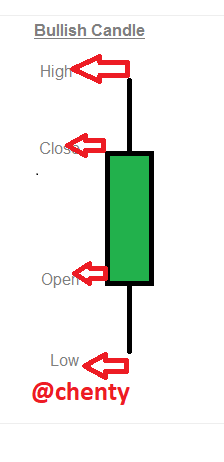
A bullish candle occurs when the market is in a continuous upward or uptrend.
This means that the prices of market assets keeps increasing due to a swing in the market structure.
Anatomy.
Often represented with a green colour coding.
Open component: This shows the first price kf a market asset seen at the bottom of a bullish candle during a period.
Close component: This shows the final or last price of a market asset at the bottom of a bullish candle.
High: The high component of the candle shows the highest price of the asset during a period.
Low: The low component of the candle shows the lowest lr leat price of an asset during a time in the bullish market.

Bearish Candle.
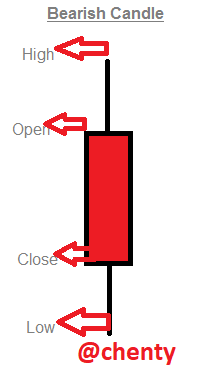
A bearish candle occurs when there is a decrease or reduction in market price of an asset.
Anatomy.
Often represented with a red colour coding.
Open component: Shows or represents the first price of a market asset during the start of an uptrend or top of the bearish candlestick.
Close component: This shows or represents the last price of an asset during a period of time and observed at the bottom of a bear candle.
High component:This represents the highest price of an asset during a bearish trend during a period.
Low component: This represents the least price of a market asset during a period of time in the market structure.

Conclusion.
I would like to say a very big thank you to prof @reminiscence01 for this very informative lecture.
I have learnt that the candestick is a very good technical analysis tool to use for market analysis as well as the bar and line charts.
I have learnt the bullish and bearish trends or candlesticks and I can identify when there is open, high, close and low price points in a market using the Japanese candlestick method.
Thank you.
By going through such kind of homework trust now it's even clear idea about the candlestick chart and thanks for this nice more
Downvoting a post can decrease pending rewards and make it less visible. Common reasons:
Submit
Thank you for taking the time to read my work. This homework has helped us to understand charts better.
Downvoting a post can decrease pending rewards and make it less visible. Common reasons:
Submit
Hello @chenty , I’m glad you participated in the 2nd week of the Beginner’s class at the Steemit Crypto Academy. Your grades in this task are as follows:
Observations:
Your explanation is brief in this section. You could have explored more.
Recommendation / Feedback:
Thank you for submitting your homework task.
Downvoting a post can decrease pending rewards and make it less visible. Common reasons:
Submit
Thank you for your review prof. I hope to do better in the subsequent tasks
Downvoting a post can decrease pending rewards and make it less visible. Common reasons:
Submit