Hello everyone!
Hope you are doing great with your homework. In this week's 2nd part of the Ichimoku-Kinko-Hyo Indicator, we learned about an interesting indicator Kumo cloud. After going into detail here I am submitting my assignment and hope it would be up to the required standerd.
1. Discuss your understanding of Kumo, as well as its two lines. (Screenshot required)
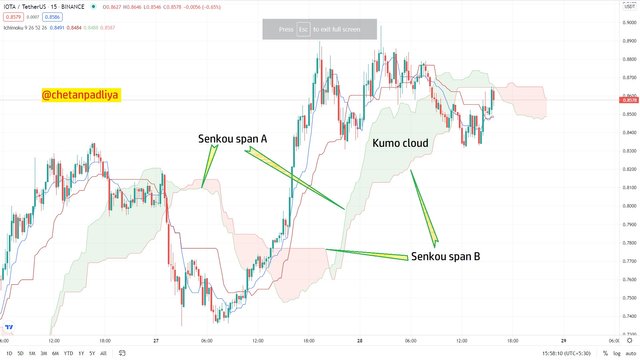
Kumo, also known as Ichimoku Cloud is a collection of technical indicators that show support and resistance levels, as well as momentum and trend direction. It is formed by two indicators of the Ichimoku-Kinko-Hyo Indicator. The space between Senkou span A and Senkou span B is known as Kumo cloud.
In part 1 of the lesson we have learned about Senkou span A (SSA) and Senkou span B (SSB)
Senkou span A (SSA) It is one of the indicators of the Ichimoku-Kinko-Hyo Indicator also known as leading span A and one of the edges of the Kumo cloud. It not only gives ideas of support and resistance but is also used to measure price movement.
Senkou span B (SSB) Like SSA it is also one of the indicators of the Ichimoku-Kinko-Hyo Indicator also known as leading span B and one of the edges of the Kumo cloud. Unlike SSA it is calculated by 52 periods and plotted the same as SSA 26 periods ahead. It also works as support and resistance and shows price movement.
Kumo helps traders to identify resistance and support, price momentum, determine trading signals etc.
Here we will study Kumo in three phases of the market viz. uptrend, downtrend and sideways.
The entire cloud is plotted 26 days ahead of the last price point to indicate future support or resistance.

2. What is the relationship between this cloud and the price movement? And how do you determine resistance and support levels using Kumo? (Screenshot required)
There is a clear relationship between price movement and Kumo cloud.
Kumo in Uptrend market
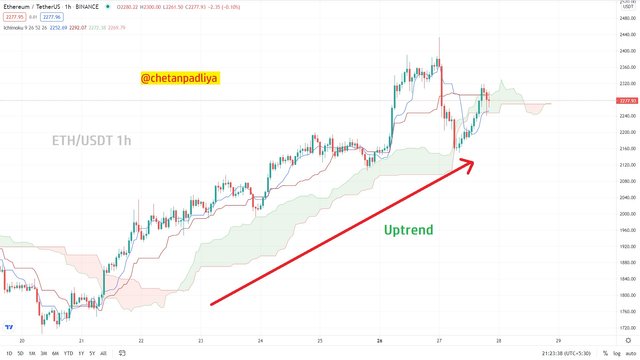
When the market is bullish or in an uptrend SSA form the upper edge and SSB form the lower edge of the Kumo cloud. The price line also formed above the Kumo. It is clear from the screenshot of the ETH/USDT 1 hr chart below.
Kumo in a Downtrend market
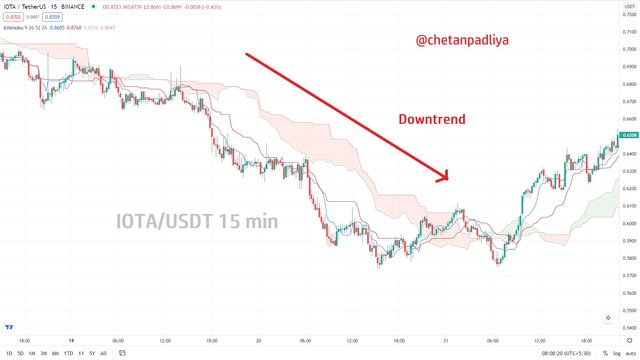
It is just opposite to the uptrend market and SSA form the lower edge while SSB forms the upper edge of the cloud. Also price line formed below the cloud. We can see this in the chart of IOTA/USDT below.
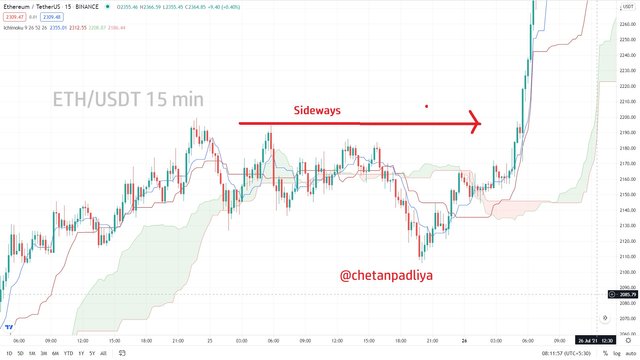
Kumo in Sideways market
In such type of market price trade in a range and cloud is almost flat as compared to upward or downward market. We can see this situation in the chart below.
Resistance and support levels
Traditional support and resistance lines are drawn flat in the chart but in the highly volatile market such flat support and resistance doesn't work properly. Here Kumo cloud solves this problem and shows support and resistance in the volatile market.
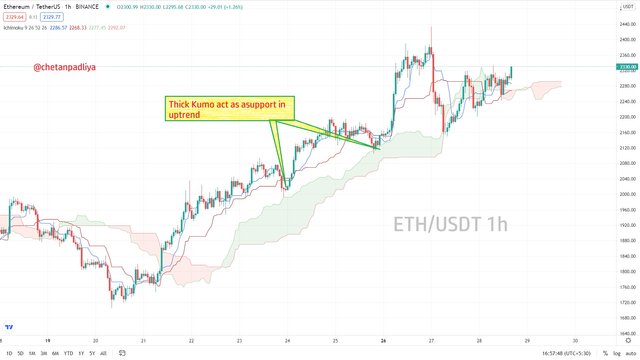
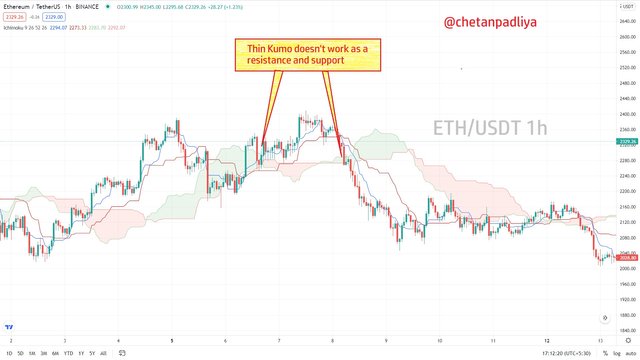
When there is a large price movement either upward or downward thick Kumo cloud is formed and works as strong support and resistance. In a sideways market, clouds are thin and make week support and resistance. In such a situation price goes above and below the cloud frequently.
Thick Cloud
Thin cloud
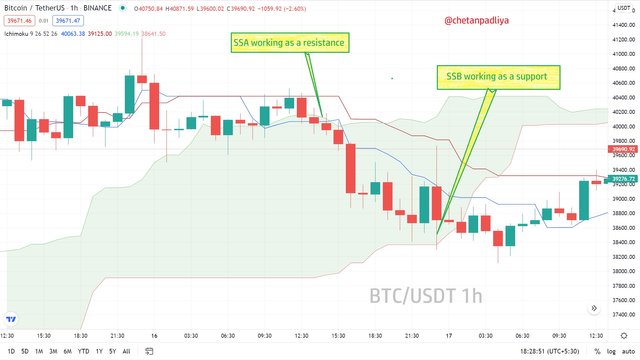
Resistance and support inside the cloud
For short term/intraday trade SSA and SSB working as a resistance and support, which is clearly visible in the chart below.

3. How and why is the twist formed? And once we've "seen" the twist, how do we use it in our trading? (Screenshot required)
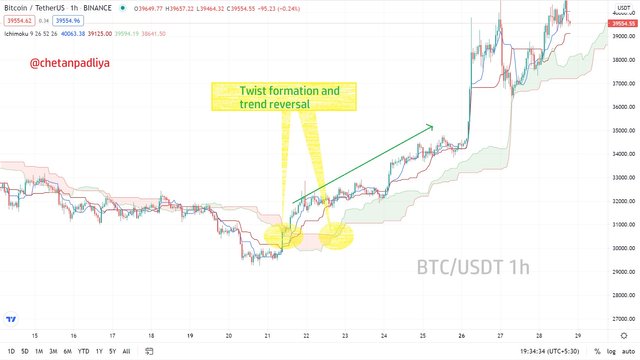
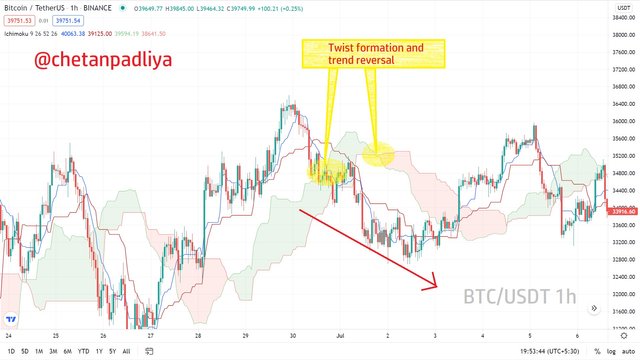
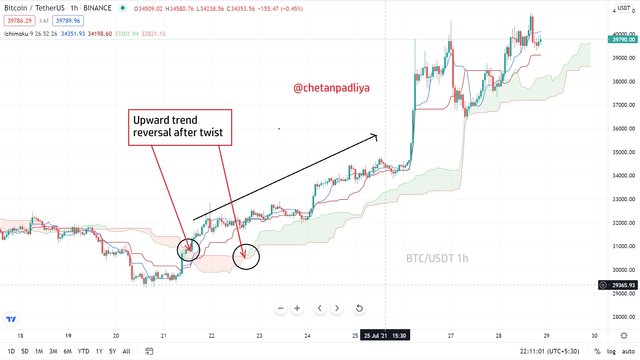
The twist is formed in Kumo when SSA crosses SSB in an upward or downward trend. As the thickness of the cloud decreases i.e. space between SSA and SSB decreases there is a high probability of twist formation.
Relation between twist and trend
The twist is an indicator of a trend reversal, and a reversal maybe for a short duration or for a long duration. The twist happens in three conditions.
Twist and upward trend reversal
When the market is in a downward trend for some time and SSA crosses SSB to go up a twist is formed which indicate the trend reversal. (To initiate the trade strand reversal should be confirmed with other indicators)
Twist and downward trend reversal
When the market is in an upward trend for some time and SSA crosses SSB to go down a twist is formed which indicate the trend reversal.
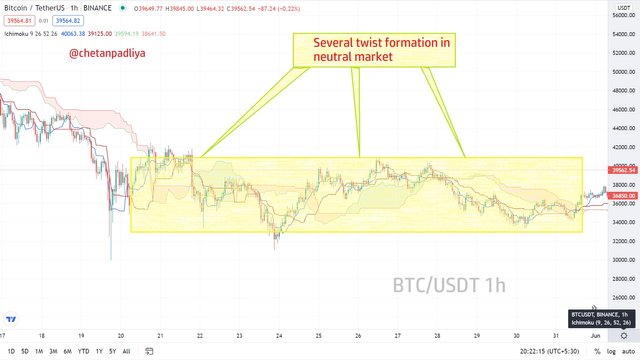
Twist and sideways market
When market trade is a range-bound for sometimes twists can be formed several times. In a neutral market, it doesn't indicate any trend reversal, but a breakout can be predicted if it is combined with other indicators. Here in the chart below, we can see how twists form in a flat market.
Twist and trade
As twist is a signal of a trend reversal and works more effectively in upward or downward market as compare to sideways market. If the market is in an upward trend and twist form at such point profit can be booked.
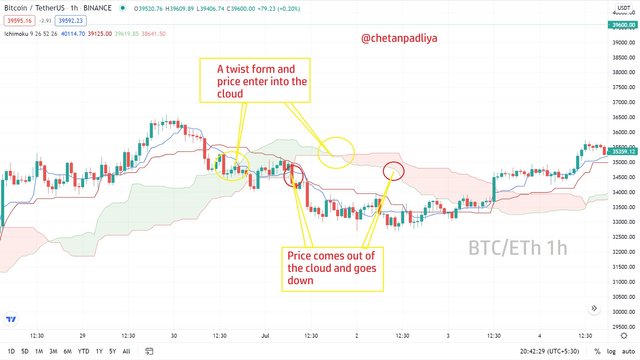
Similarly, if the market is in the continuous downward trend and twist form, in such case short position can be closed to book the profit.

4. What is the Ichimoku trend confirmation strategy with the cloud (Kumo)? And what are the signals that detect a trend reversal? (Screenshot required)
Twist formation is definitely a sign of trend reversal but it is not a confirmation. It is also possible that after the formation of a twist price may remain sideways for some time and then make a reversal or maybe remain in the same trend. Along with twist formation, some other indicators must be kept in mind to confirm a trend reversal and initiating a trade.
Formation of twist
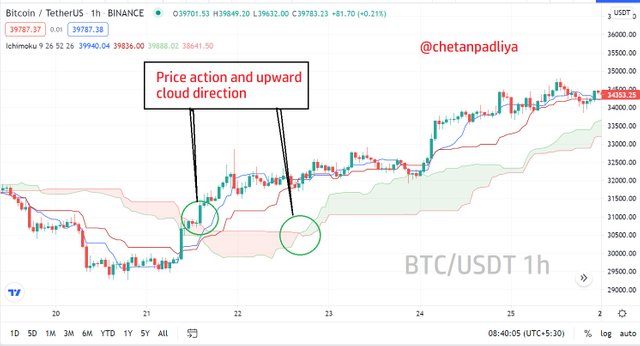
It is the first indicator of a trend reversal but as I said earlier it is not the confirmation so after twist other indicators like cloud direction, price action and Chikou span must be considered before initiating any trade.
Direction of cloud
In a downward market after twist if SSA crosses SSB and goes upward direction it means cloud direction will be upward and it is the indication of price reversal from downward to upward.
Price action
After penetrating the cloud price trade within the cloud trader must wait for a clear breakup or break down. As soon as price breaks the cloud and close the candle outside the cloud it is the indication of a trend reversal.
Chikou span
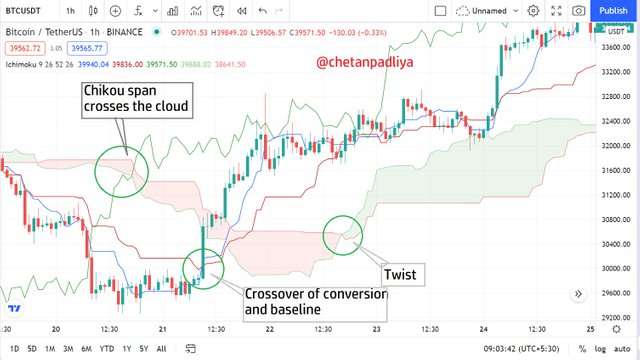
Chikou span is a lagging span plotted 26 periods behind the price so with twist and price action if Chikou span breaks the cloud and moves in the direction of cloud and price a buy or sell trade can be initiated according to market direction.
Crossover of conversion and baseline
An upward trend reversal can be confirmed if the conversion line crosses the baseline and moves upward in the direction of cloud and price line after twist formation.

5. Explain the trading strategy using the cloud and the Chikou span together. (Screenshot required)
Chikou span is a lagging indicator component of the Ichimoku Kinko Hyo. It is the current price line but plotted 26 periods behind the price line. Where the cloud lines are is plotted 26 periods ahead of the current price line.
Chikou span helps to visualize the relationship between current and prior trends. If Chikou span is trading above the 26-period prior price it is considered the uptrend and opposite of that if Chikou is below the 26-period prior price is considered a downtrend.
Observing Chikou span and cloud together trend of the market can be confirmed and according to that trade can be initiated.
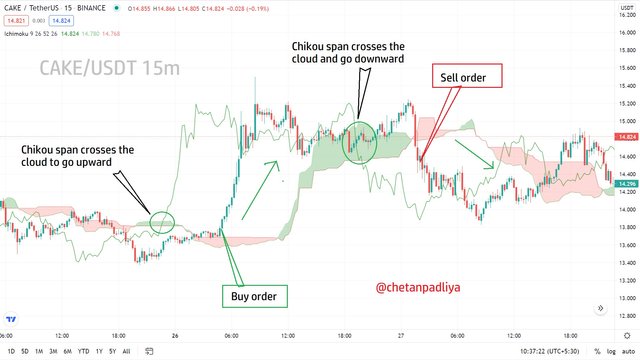
In the above chart of CAKE/USDT 15 min, there are two situations. Upward trend confirmation and downward trend confirmation using Chikou span and cloud.
In the first condition Chikou span crosses the cloud and move upward. As soon as it crosses the cloud and the candle is closed outside the cloud from the next candle a buy position can be taken. Here we confirmed the upward trend as Chikou is above the price line, cloud direction is also in an upward direction and chikou is far from the current price line. the stop loss should be below the cloud.
In the second condition which is just opposite to the first one. Chikou span crosses the cloud and goes downward, the cloud is also in downward after twist and the current price is far from the Chikou span. Here a sell trade can be initiated as soon as Chikou span comes out of the cloud and the candle close, from the next candle sell position, can be taken. The stop loss should be above the cloud.

6. Explain the use of the Ichimoku indicator for the scalping trading strategy. (Screenshot required)
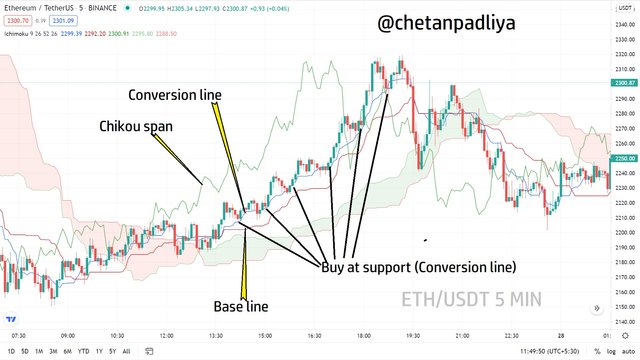
Ichimoku indicator can be a good tool for scalpers. Scalpers generally use short term charts like 5, 10 or 15 minutes and the Ichimoku indicator works on all time frames. To start scalping 1st trend must be identified. For demonstration, I took an example of the ETH/USDT 5 min chart.
Scalping in an upward trend
Here the trend is clear upward as Chikou span is above the price line and the price line is above the cloud. The conversion line is above the baseline which is also a signal of an upward trend. In the chart, we can see price is taking continuous support on the conversion line and bouncing back. A scalper can initiate the buy trade at every support and book profit as the Ichimoku indicator is in an uptrend.
Scalping in a downward trend
It is just the opposite of upward trend scalping.
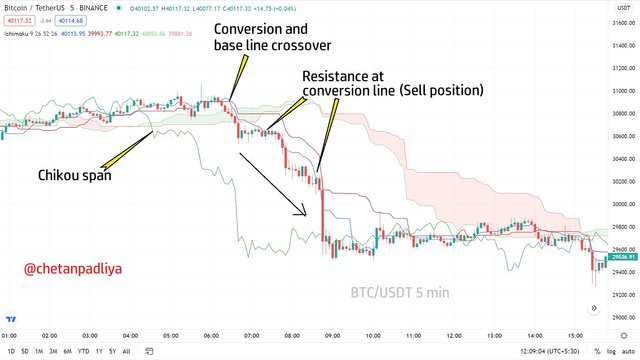
In the chart below at first crossover of conversion and baseline is observed and a twist is formed in the cloud which is an indication of a downward trend.
The conversion line is below the baseline which also indicates a downward trend.
The price line is above the Chikou span and the cloud is above the price line which confirms that trend is downward. We can see that such a downward trend conversion line is working as resistance and price tested the resistance several times during the downward trend. These resistance levels are the opportunities for scalpers to take buy entry trade and book small profits.

7. Conclusion:
Kumo cloud is a part of one of the best technical indicators known as the Ichimoku-Kinko-Hyo Indicator and it's the most noteworthy of the five indicators of Ichimoku. Kumo cloud with the whole indicator can be applied on any time frame therefore it is useful for all traders from scalpers to long term traders.
In this lesson about Kumo cloud, I learn about how it gives an indication of upward, downward and sideways market trends, how it works as support and resistance and how it can be beneficial for short term and long term traders.
The combination of Chikou span and Kumo is found an excellent indicator to confirm trend reversal and initiate a trade at right time to make the trade profitable.
I am thankful to prof. @kouba01 for this interesting and informative lecture.


Congratulations! Your post has been selected as a daily Steemit truffle! It is listed on rank 19 of all contributions awarded today. You can find the TOP DAILY TRUFFLE PICKS HERE.
I upvoted your contribution because to my mind your post is at least 6 SBD worth and should receive 21 votes. It's now up to the lovely Steemit community to make this come true.
I am
TrufflePig, an Artificial Intelligence Bot that helps minnows and content curators using Machine Learning. If you are curious how I select content, you can find an explanation here!Have a nice day and sincerely yours,

TrufflePigDownvoting a post can decrease pending rewards and make it less visible. Common reasons:
Submit
Hello @chetanpadliya,
Thank you for participating in the 5th Week Crypto Course in its third season and for your efforts to complete the suggested tasks, you deserve a 5/10 rating, according to the following scale:
My review :
An article with average content that contained answers to some questions that lacked depth in the analysis, and I will justify some of the observations for you:
Your interpretation of the cloud and its lines was poor in terms of analysis and content. Also, be aware that you are at risk of plagiarism from https://www.investopedia.com/. Try writing definitions using your own words.
Regarding the second question, the relationship between price action momentum and the cloud is not well explained, which mainly depends on the thickness of the latter, and focused only on its relationship to the trend. This is what was asked of you in the fourth question in its first element and you did not delve into its analysis.
Thanks again for your effort, and we look forward to reading your next work.
Sincerely,@kouba01
Downvoting a post can decrease pending rewards and make it less visible. Common reasons:
Submit
Thank you, prof, for your valuable feedback, will try to improve my work in the next assignment.
Downvoting a post can decrease pending rewards and make it less visible. Common reasons:
Submit