Hello Steemians!
Hope you all are performing well in Steemit Crypto Academy and enjoying the various courses. Here I am submitting my assignment for the lesson about Trading with Accumulation / Distribution (A/D) Indicator. I hope my assignment will be up to the required standard.
1. Explain in your own words what the A/D Indicator is and how and why it relates to volume. (Screenshots needed)
A/D indicator
It is an Accumulation/Distribution indicator and as the name suggests it has two different phases, viz accumulation and distribution phase. This is a volume-based indicator that is used to identify the trend of an asset on the trading chart, using the relation between the price and volume flow.
Accumulation phase
The accumulation phase occurs when the price of the asset has fallen significantly and seems undervalued. At this time a lot of buyers starts to accumulate at a lower price in the anticipation that the price will go up.
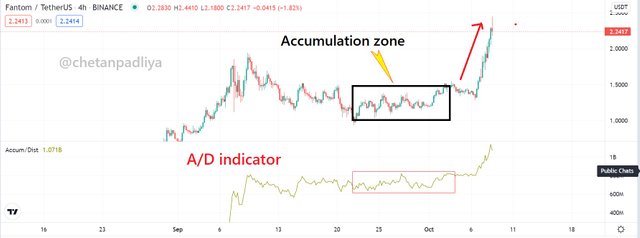
In the screenshot above it is observed that after falling the price it was trading in a narrow range for some time, which is known as the accumulation phase and after that price started to move upside.
Distribution phase
It is just the opposite of the accumulation phase. After the significant price rise, the asset become overpriced and, becomes started to trade in a narrow range and traders who bought at lower prices started to sell. It is known as the distribution zone or phase.
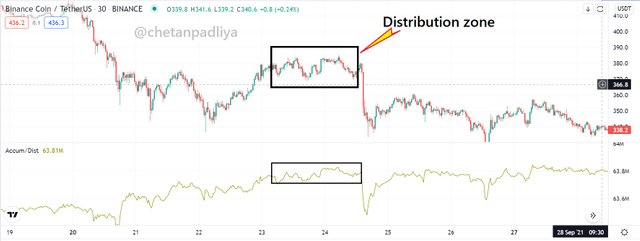
In the above chart, it is observed that after a significant upside of BNB it traded in a limited range for some time and started to move downward after the distribution phase was completed.
Here the A/D indicator shows how supply and demand influencing the price. A/D indicator can move in the same direction of the price or in the opposite direction. It is a volume-based cumulative indicator that indicates whether an asset is being accumulated or distributed.
When there is a diversion that the indicator goes in the opposite direction of the price line it shows the weakness of the trend and reversal is possible. If the price is going up but the indicator is going down in such a case it indicates that buyers volume is getting exhausted and the trend is getting weak. In a downward trend, if it goes up, that is the indication that selling pressure is getting exhausted and the trend has become weak.
Relation between volume and A/D indicator
As stated earlier it is a volume-based indicator so when the price of the coin is near the high of the selected period range and at the same time volume is also increased then there are chances that there will be a spike in A/D indicator. On the other hand, if the price is near the high of the period range but volume is not increased then there will not be much movement in the A/D indicator.
If the situation is opposite here that price closes near to the selected period's low price, here also the volume plays an important role in the decline of the A/D indicator.

2. Through some platforms, show the process of how to place the A/D Indicator (Screenshots needed).
For this task, I am using the Tradingview.com platform
Opened any chart, here I opened BNB/USDT
Clicked on Indicator (f), searched for Accumulation/Distribution indicator and applied that on the chart.

- It is visible below the price graph.

Clicked on the setting, there are three parameters to be adjusted. I kept all default.
Indicator timeline was kept the same as a chart.

Source of all the above screen shots

3. Explain through an example the formula of the A/D Indicator. (Originality will be taken into account)
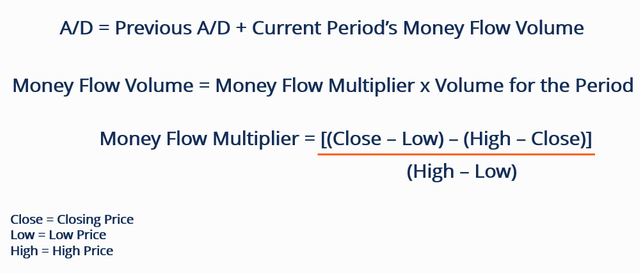
The value of A/D is equal to the sum of the value of the previous period A/D plus the current periods' money flow volume.
Money flow volume is the product of the Money flow multiplier and volume of the period.
Money flow multiplier is calculated as shown below
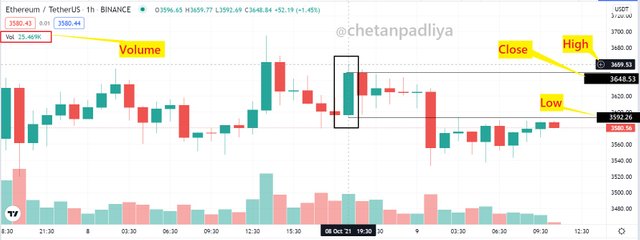
For calculation, I extracted the required value from the ETH/USDT 1h chart below.
Closing value (C) = 3648.53
High of the period (H) = 3659.53
Low of the period (L) = 3592.26
Total volume of the period = 25469
To find out the value of Money Flow Multiplier (MFM) the above value is placed in the formula
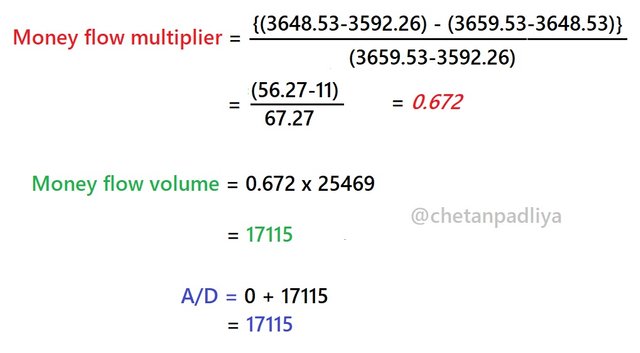
Here we consider it as a 1st A/D so the previous A/D is taken 0.
The final A/D value is 17115

4. How is it possible to detect and confirm a trend through the A/D indicator? (Screenshots needed)
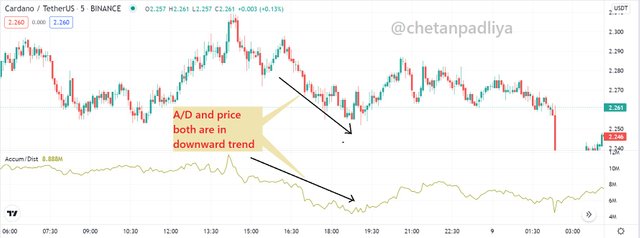
This indicator moves in the direction of the price movement so it is easy to identify the trend with the help of A/D indicator.
Upward trend
When there is a buying activity in the market and it continues then supply get reduced, as a result, the price started to move in an upward direction. At the same time, more buyers jumped in to take benefit of the price hike and volume also increased.
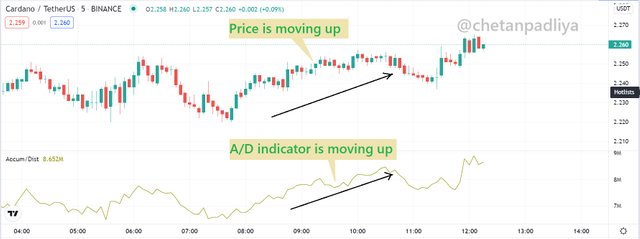
A/D indicator is a volume-based indicator that is calculated by using the price and volume, so if both increases it also moves in the upward direction. Thus an upward trend can be identified easily.
Downward trend
This is just opposite to the upward trend and the indicator moves on the downside when prices fall continuously. When the seller become active in the market and started to sell to book profit, more people jump in to see the trend and also sell their asset. As a result, the volume also increases and the A/D indicator gives a negative value and moved downward.
Divergence for trend reversal
When the indicator and price move in the opposite direction a divergence is observed. This shows the weakness of the trend and a trend reversal is expected. It may be bullish divergence or bearish divergence.
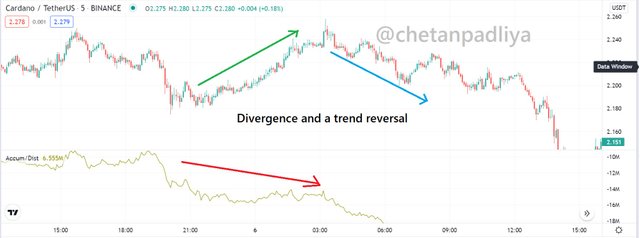
Divergence is a phenomenon when in the upward trend buyer activities decreases and it shows the weakness of the trend. Same in the downward trend seller become less active and downward trend become weak.

5. Through a DEMO account, perform one trading operation (BUY or SELL) using the A/D Indicator only. (Screenshots needed).
For this task, I used the tradingview.com platform. The pair I selected was DOGE/USDT on 15 min chart.
A divergence pattern was observed where the price was moving down and the A/D indicator was in opposite direction.
Price was moving with lower high and lower low. A line was drawn on high points.
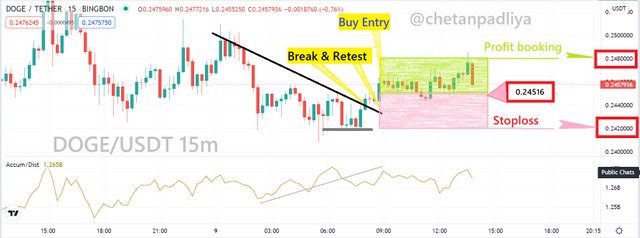
Waited for some time if it breaks line that working as a resistance.
Resistance was broken and after going up it retest the line as a support and move up. (BRB strategy applied)
Now that was the time to take the buy entry as soon as it crosses the immediate peak. Stoploss was fixed at the lower point of the price as shown in the screenshot and profit booking decided to 1:1 ratio.
After waiting some time profit was booked.
The figure of the trade-
Buy entry - 0.24516
Stop loss - 0.24200
Profit booking - 0.24800
Total profit earned 0.24800-0.24516 = $0.00284 per coin

6. What other indicator can be used in conjunction with the A/D Indicator? Justify, explain and test. (Screenshots needed.
There are various indicator can be used with A/D indicator to confirm the trend and trend reversal to initiate the trade. Using more than one indicator always improve the chances of a successful trade. here I applied 2 more indicators on the chart of ETH/USDT with A/D indicator.
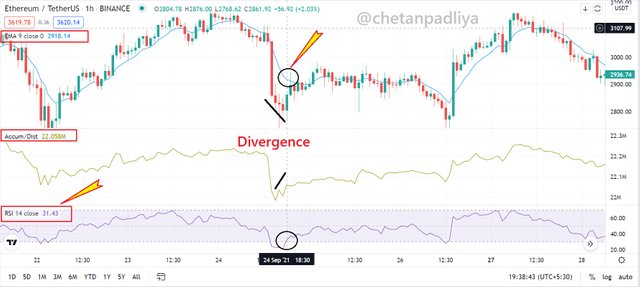
A/D indicator - A divergence is observed which is a sign of expected trend reversal soon.
RSI - RSI was below 30 and just entered under 30 points as shown in the chart above it is also a sign of trend reversal.
EMA - EMA was below the price line but was just crossing the price, it is also an indication of price reversal.
It is clear from all the 3 indicators that all showing expected trend reversal and trend reversal was observed after that. A buy entry trade could be set up after confirmation of all three indicators.

Conclusion
Accumulation Distribution indicator is a very easy yet effective indicator to identify the trend as well as to predict the trend reversal. It is observed that this indicator moves in the direction of the price line and confirm the current trend but when it moves in the opposite direction it indicates the possible trend reversal.
It was also interesting to learn the calculation of the A/D indicator. I did a demo trade using A/D indicator and trade was successful.
By applying other indicators with this indicator we can trade with more confidence. It is always advisable to use more than one indicator to confirm the trend and expected trend reversal. In the last task, I applied 2 more indicators and both confirmed the expected trend reversal shown by A/D indicator.
Thank you, Prof. @allbert for such an insightful and interesting lecture.


Fabulous report of accumulation & distribution indicator concepts in crypto currency world,
Thanks for sharing such a beautiful report on crypto currency in stmeet subscribers
to know & leaning in trading crypto currency,pls keep sharing your info w/ stmeet world & be strong
@chetanpadliya
#affable
Downvoting a post can decrease pending rewards and make it less visible. Common reasons:
Submit
Thank you for your kind words!
Downvoting a post can decrease pending rewards and make it less visible. Common reasons:
Submit
You have been upvoted by @sapwood, a Country Representative from INDIA. We are voting with the Steemit Community Curator @steemcurator07 account to support the newcomers coming into Steemit.
Engagement is essential to foster a sense of community. Therefore we would request our members to visit each other's post and make insightful comments.
Thank you.
Downvoting a post can decrease pending rewards and make it less visible. Common reasons:
Submit
Downvoting a post can decrease pending rewards and make it less visible. Common reasons:
Submit
Get lost
Downvoting a post can decrease pending rewards and make it less visible. Common reasons:
Submit
THIS IS A SCAM - DO NOT CLICK ON THE LINK
Downvoting a post can decrease pending rewards and make it less visible. Common reasons:
Submit
Hi steemit team,i request @steemitblog and @steemcurator01 and @steemcurator02 to kindly consider my issue and please recover my hive account that was stolen.both my steemit and hive accounts are stolen and i got my steemit account recovered and i left out with hive.for my both accounts recovery account is @steem
I got my steemit account recovered
Please recover my hive account too.i sent all details regarding recovery in email to [email protected] check once.
With regards,
summisimeon
Downvoting a post can decrease pending rewards and make it less visible. Common reasons:
Submit