Hello everyone!
Hope you all are performing well in Steemit Crypto Academy and enjoying the various courses. Here I am submitting my assignment for the lesson about Trading with Contractile Diagonals. I hope my homework will be up to the required standard.
1- Define in your own words what a contractile diagonal is and why it is important to study it. Explain what happens in the market for this chart pattern to occur. (screenshot required / Bitcoin not allowed)
Contractile Diagonal
It is a pattern on the price chart of any asset that formed in an upward as well as in a downward trend. It is observed on the chart in an upward direction when price movement makes higher high and higher low but the waves become smaller from the previous one. Similarly, it is observed in a downward direction when lower low and lower high formed with smaller waves. There are some rules to identify the perfect Contractile Diagonal pattern.
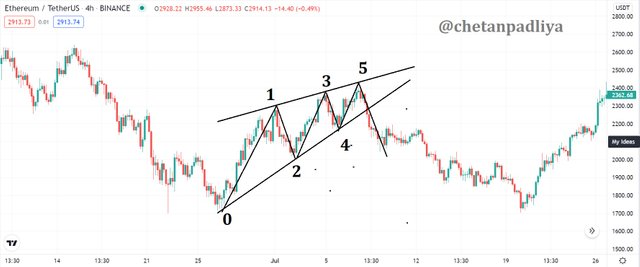
Waves 1, 3, 5 should be in the direction of the trend and waves 2 and 4 are the correction waves.
Wave 1 > 3 > 5 and wave 2 > 4.
One Diagonal must join 1,3 and 5 and another should be made by joining 2 and 4
Both the diagonals must meet at some point.
Importance of Contractile Diagonal
A perfect Contractile Diagonal pattern is a signal of a trend reversal and these diagonals lines also behave as support and resistance. By observing it carefully a trade can be initiated to make a profit.

2- Give an example of a Contractile Diagonal that meets the criteria of operability and an example of a Contractile Diagonal that does NOT meet the criteria. (screenshot required / Bitcoin not allowed)
Contractile Diagonal that meets the criteria
The following Contractile Diagonal pattern is observed in ETH/USDT 4h chart.
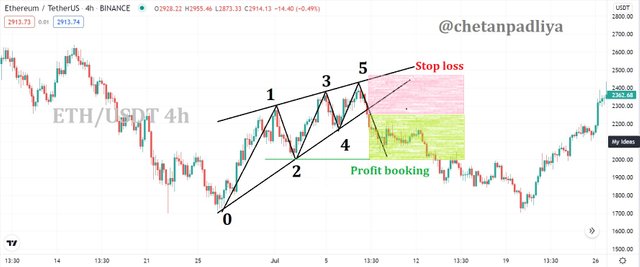
In the above chart, it is clearly visible that the trend is upward and waves 1>3>5. Connecting the peaks 1,3 and 5 makes an upward straight line similarly 2 and 4 make a diagonal also in an upward direction. By extending both diagonals they will cross each other.
Trade setup
Entry
Using Contractile Diagonal a trade can be set up. In case of an upward trend, a pattern of sell entry trade can be initiated. As marked in the graph above as soon as the price crosses the diagonal in a downward trend after wave 5, a sale trade can be initiated if a new red candle is formed after breaking the line.
Exit
A stop loss should be just at the level or above the peak of wave 5 and a profit booking level can be set up at the peak of the correction wave 2.
Contractile Diagonal that does NOT meet the criteria
In the following IOTA/USDT 30m chart it seems near to the perfect Contractile Diagonal pattern but it does not complete all the rules of the pattern.
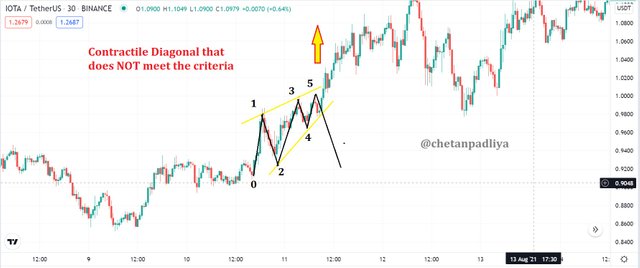
It is observed in the chart that wave 1 is smaller than wave 3, so it doesn't follow the 1st requirement. If the pattern is perfect as a result there should be a breakdown and price movement on the downside but here the price breakout movement occurs in the opposite direction than expected.

3- Through your Verified exchange account, perform one REAL buy operation (15 USD minimum), through the Contractile Diagonal method. Explain the process and demonstrate the results and graphical analysis through screenshots. Your purchase data must match your analysis data: such as cryptocurrency and entry price.
Real trade to demonstrate Contractile Diagonal method
The pattern was observed on FTM/USDT 4h
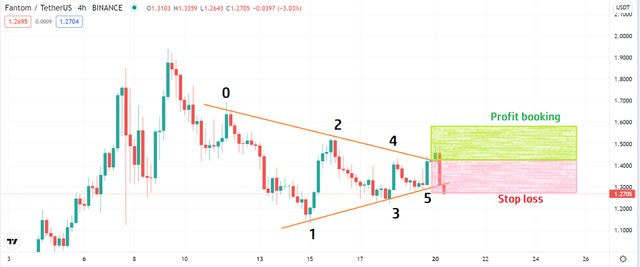
- I observed the pattern on the chart on the 19th of Sept and waited to complete the pattern perfectly.
- The wave pattern was as required, wave 1>3>5 in the downward trend.
- The wave completed and took a breakout above the diagonal.
- Waited for the next green candle to initiate the trade.
- As soon as the next green candle started I took the buy position at $1.423 for 14 FTM.
- Stoploss set just below the peak of the 5th wave i.e. at about 1.27and profit booking decided at the level of wave 2 i.e.at $1.58.
- The next candle after initiating the trade become red and started to move in the opposite of the expected direction.
- In the next candle stop-loss hit.
- Trade was in the loss.
Proof of the trade
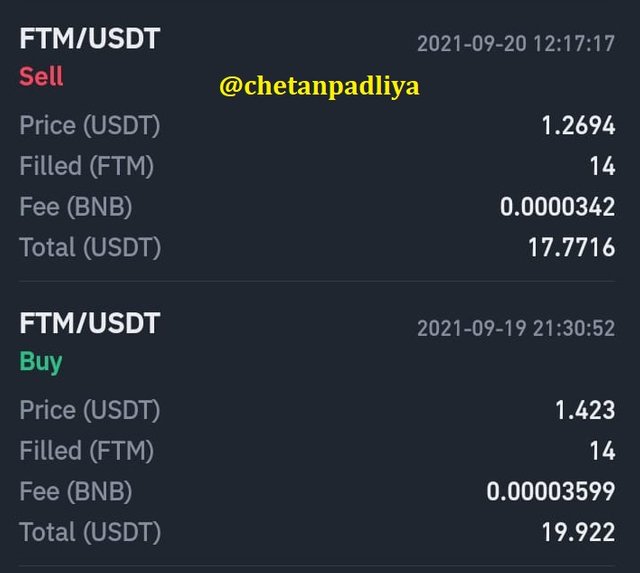

4- Through a DEMO account, perform one sell operation, through the Contractile Diagonal method. Explain the process and demonstrate the results and graphical analysis through screenshots. Bitcoin is not allowed.
Demo trade to take sell entry to demonstrate Contractile Diagonal method
The pattern was observed on Steem/BTC 15m chart.
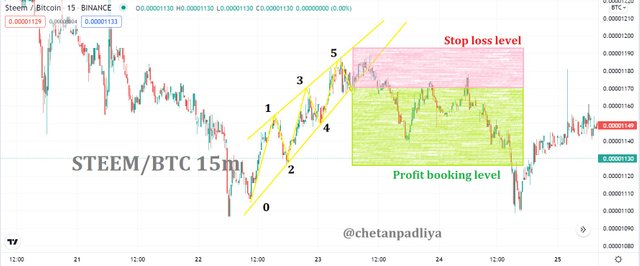
- On the above chart I observed the pattern on 23rd Sept and waited to complete it perfectly.
- The pattern was as required, wave 1>3>5. in the upward trend.
- The 5th wave was completed and it took breakout at diagonal.
- At the next candle I took the sell entry (Though only demo trade was required to complete the task but I initiated a real sell entry trade) at BTC 0.00001168 (proof in the next screenshot).
- Stoploss market at peak of wave 5 i.e about 0.00001189 BTC and profit level market at 0.00001128 BTC
- Profit level was achieved after waiting for a long time.
- As it was a demo trade so I didn't book the profit at that level.
- Trade was profitable.
proof of the trade
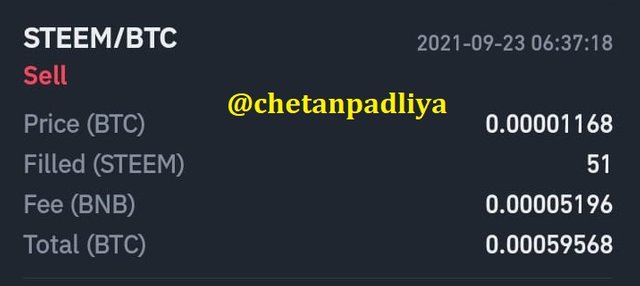
5- Explain and develop why not all contractile diagonals are operative from a practical point of view. (screenshot required / Bitcoin not allowed)
Contractile Diagonals are not operative if it doesn't follow all the rules of the pattern. As mention above the wave 1>3>5 and wave 2>4. A diagonal drawn must be touched to all the peak points of the waves. A breakout must be clear and stop loss and profit-booking points should not be at a high-risk reward ratio.
To understand this I observed the following pattern on Harmont/USDT 15m chart as below.
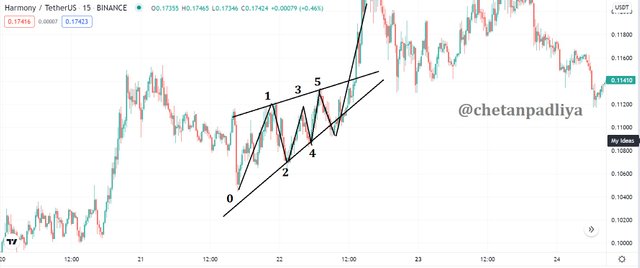
In the above chart, it follows the rule of wave 1>3>5 and 2>4 but the diagonal didn't touch the peak the wave 3, hence the diagonal is not operative and reversal breakout was not observed.
Let's take one more example to understand this
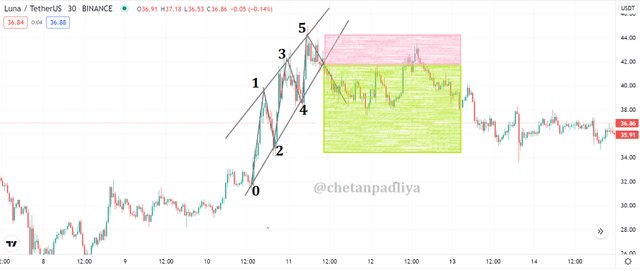
In the above chart, it is almost according to the required criteria and breakout is also observed and a trend reversal also happened but it didn't sustain and it bounced back in the trend's direction. Here the issue is with stop loss and profit booking level. Level 2 is very far from the trade initiating level and level 5 i.e the stop loss level is very close to the trade entry point. In such a situation, the risk-reward ratio is not favourable and trade become high risk.

Conclusion
Contractile diagonal patterns can be observed in any time frame but it is not so common to find a perfect Contractile diagonal pattern. But if it is found a trade can be initiated to make a profit. It can be used with another trend reversal TA to confirm the trend reversal and maximize the profit.
Thank you Prof. @allbert for such an informative and interesting lecture.


You have been upvoted by @sapwood, a Country Representative from INDIA. We are voting with the Steemit Community Curator @steemcurator07 account to support the newcomers coming into Steemit.
Engagement is essential to foster a sense of community. Therefore we would request our members to visit each other's post and make insightful comments.
Thank you.
Downvoting a post can decrease pending rewards and make it less visible. Common reasons:
Submit