

1. Explain your understanding of charts, candlesticks, and time frames. (Use your own words and put screenshots)
Understanding what a chart by trading is very important because charts are one of the most important aspect when it comes to trading because this trading charts usually represent historical price, data, time interval and volumes graphically on a chart. Inside the chart, the data and information of asset price is usually used by traders to figure out and spot good entry and exit points as the price of the asset rise and fall since the chart is use to make good technical analysis simply by predicting the future price of an asset by studying the past price
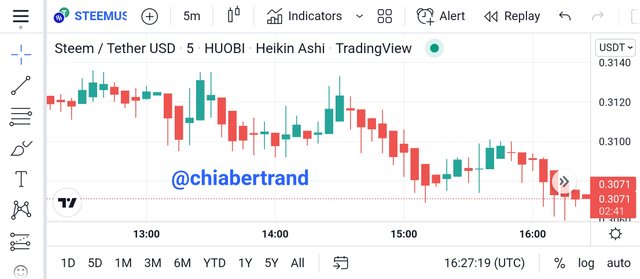
One good thing about this charts are that they are divided into so many types such as candlestick, Heikin Ashi, bar, line and so many others. The graphical representation of the price in the chart usually reflects on the emotions of traders since it helps traders to determine trend directions
Understanding what a candlestick by trading is very important because this candlestick represents movement of asset prices which is found on a chart. They are two major types of candlesticks on a chart, one represent Bearish candle and the other Bullish candle. Each of this candlestick always represents a unique input of technical information about what is happening to buyers and sellers in the market over a certain period of time. This information that this candles usually represent are hammer, inverted hammer, Doji, harami, hanging man, morning start, shooting star, etc. All of this represent technical information about what is happening and what is to happen in the market
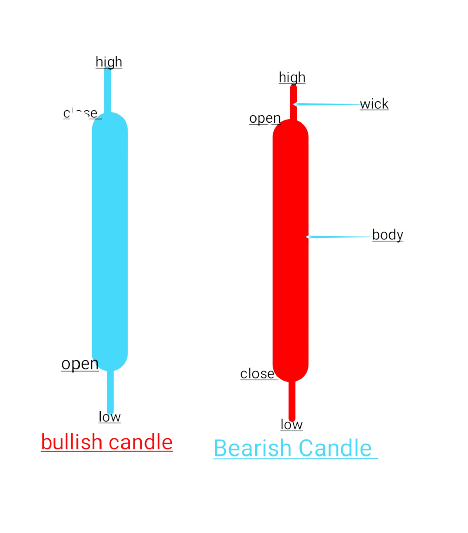
This two candlestick usually has four main information embedded within it which are open, high, low and close. The Candlestick is composed of a body, upper and lower wicks with main colours as green which signifies bullish candlestick and red, which signifies bearish candle. However, traders can still change the colors to their desire satisfaction
Understanding what a timeframe by trading is very important because this determine the type of trader one could be because we have types of traders such as scalp, intraday and swing traders that trade best at different timeframes. We also have long term traders that trade and hold assets for months or even years. So understanding different timeframes will enable the trader to know the timeframe that work best for him since timeframes represent price movement within a specific period of time
So at this various time frames, price of an asset usually represents the time choosen by the trader and each candle represent time. For instance, for a 4-hour timeframe, each candle you see on a chart represent 4 hours. This goes thesame for the other time frames.
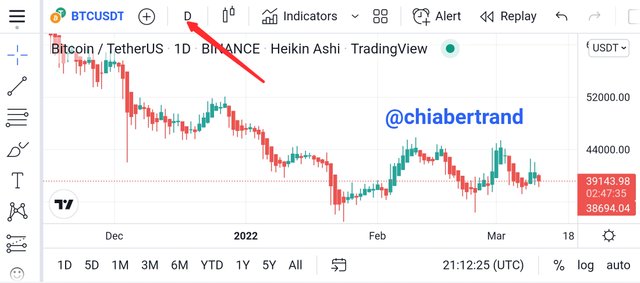
From the BTCUSD chart above, I have chosen 1-day timeframe which simply means that each candle you see represent 1-day. Once a trader knows which timeframe work best for him, he might always use it as an advantage to make profit because each time frame work differently for different traders. Since I'm a scalp trader, 15 to 30 mins timeframe works best for me

2. Explains how to identify support and resistance levels. (Give examples with at least 2 different graphs)
It should be noted that when carrying out trading, traders need be able to determine the support and resistance levels because they usually use this levels in other to carry out past analysis and then use it to predict future price of any crypto asset. This is usually done simply by drawing horizontal lines or trendlines on a chart. Fibonacci retracement can also be used by traders to mark out this zones on a chart and I will explain it along the way
It should be noted that the support and resistance zones always act as obstacles in not letting the prices of an assets to be getting pushed to a certain further direction and this level always let traders to look for trading opportunities within exact areas where prices of crypto assets usually reverse. Let me explain this in full Belloe
Support Zone is referred to as the lower range of an asset price which act as support because it was never broken previously with a higher range which act as resistance. As a result of concentration of high demand, the support point always have a temporer paused because price of a crypto asset usually fail to break and closed below this zones hence causing a change in it's direction. There is usually very high buying pressure(demand) at this point which causes the market to resist hence pushing the price of the asset upward
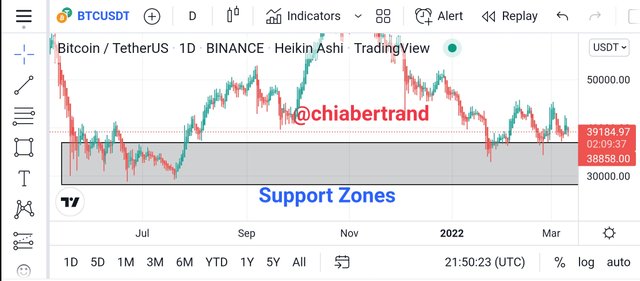
From the BTCUSD chart above, we can see how the price of BTCUSD had maintained a support between 38858.00 and 39184.97 but we see that the preceding price had failed to close from below this support zone hence enabling buyers to create good long opportunities by making the market to move upward at a strong impulse
Resistance Zone is referred to as the upper range of an asset price which act as resistance because it was never broken previously with a lower range which act as support. As a result of concentration of high supply, the resistance point always have a temporer paused because price of a crypto asset usually fail to break and closed above this zones hence causing a change in it's direction. There is usually very high selling pressure(supply) at this point which causes the market to resist hence pushing the price of the asset downward
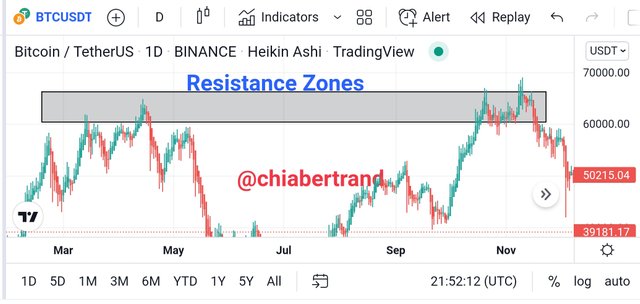
From the BTCUSD chart above, we can see how the price of BTCUSD had maintained a resistance between 60000 and 70000 but we see that the preceding price had failed to close from above this resistance zone hence enabling sellers to create good short opportunities by making the market to move upward at a strong impulse

3. Identifies and flags Fibonacci retracements, round numbers, high volume, and accumulation and distribution zones. (Each one in a different graph.)
I earlier said I will explain this. It is extremely very effective when predicting price and a good technical tool for traders to use and identify both support and resistance zones on a chart most especially in trending markers
This tool has numbers that are in percentage and are very significant and can bounce at any instance price hit them. The Fibonacci lines are visible on a chart as we can see and read the numbers and this Fibonacci and this Fibonacci lines can either be drawn on a bear or bull mark
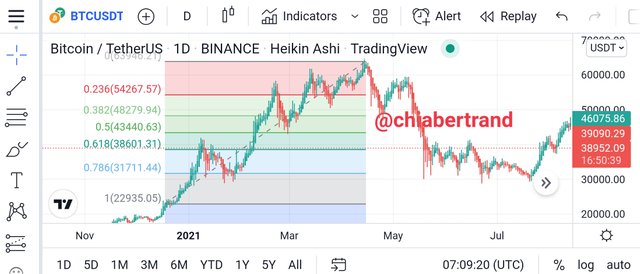
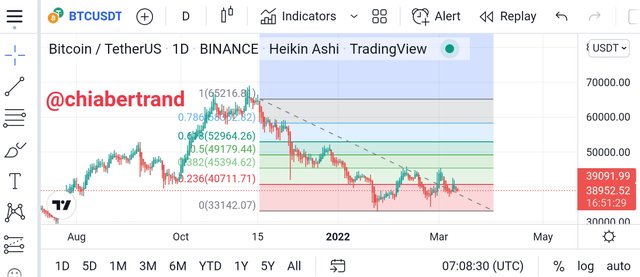
During uptrend movement, traders can use this Fibonacci tool to expand the previous support retracement from the last resistance point and in a scenario, during downtrend movement, traders can use this Fibonacci tool to expand the previous resistance retracement from the last support point. So we should know that this tool is use as market limit when ever the market rotates between the retracement and long term traders can use this retracement more effectively so as to predict future price and next price
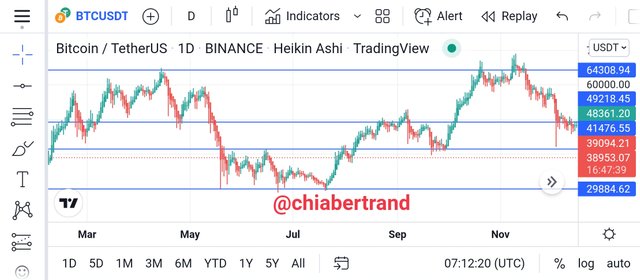
Round Numbers are generally use in understanding trend movement and at any instance when it manage to hit a particular point which happens to be any significant round figure. Traders usually wait at times for this round figures to come out so that they could use it as an entry point for trade and the round figures at times is use to determine price movement
When talking of the accumulation and distribution in trading, one should know that this are areas which are usually controlled by the strong hands in the market such as whales or huge investors hence enabling their decisions in the market have great influence. This is so because any move they do in the market turns to affect the market, for instance, when they turn to over buy, the market will be greatly influenced by the crypto asset as the price will be low and vice versa when they turn to over sell
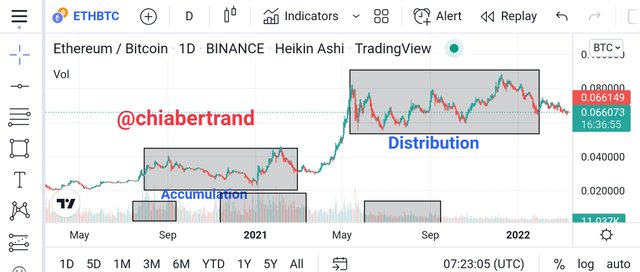
In all, medium or little investors turn to follow the strong hands in the market by dancing the tune with strong hands when ever they triggered any movement in the market. At times, this strong hands turn by hunting the weaker hand hence causing their points in liquidation enabling them this weak hands to be less significant. When ever this liquidation is hunted by the strong hands, the weak hands turn to trade but the lows in the market until when the market is pushed up in other to rise again with to form new higher hence enabling the weak hands to make profits at this period by selling off their asset within that distribution

4. It explains how to correctly identify a bounce and a breakout. (Screenshots required.)
In order for traders to correctly identify a rebounce and breakouts, they will need to have great knowledge in spotting out good support and resistance zones on a chart because they can take advantage of the both the resistance and support breakouts for a rebounce when the market bounces back to it's previous levels
So in general, a rebounce in the market usually occur anytime when price of an asset meets either support or resistance zone then take an opposite direction without necessarily breaking that zone. This is usually done continually over time until that particular zone is weakened before a breakout can occur
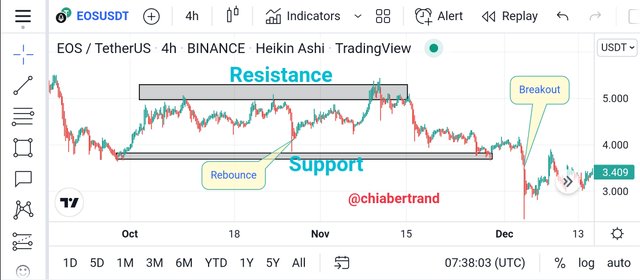
From the EOSUSDT chart above, we can see how the price of EOSUSDT rebounce back to it's initial level after a certain period of time before the price finally breaked at the support zone because it was now weak

5. Explain that it is a false breakout. (Screenshots required.)
False breakout is when ever price movement of an asset goes either above which is to resistance level or below which is to support level breakout and then reverse back it's movement by moving back towards the support or resistance levels. Traders need to be watchful of this false breakout because it can make them to take fake entries in the market which may cause them to losses
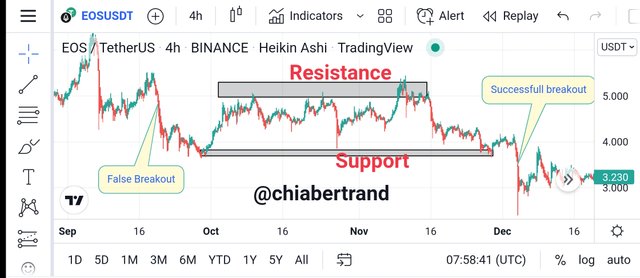
From the EOSUSDT chart above, we can see a bearish continuation as the price had to break below a support level which had to results to a fakeout of bearish movement from below before a successfull breakout had to occur as the price was weakened at that point

6. Explain your understanding of trend trading following the laws of supply and demand. It also explains how to place entry and exit orders following the laws of supply and demand. (Use at least one of the methods explained.)(Screenshots required.)
Understanding trend trading by following the laws of demand and supply in the market is highly necessarily by traders because it enables them to take advantages of those positions in the market because trend trading is another way of trading by following the trends in the market which is important.
When ever we discover the price is moving in a new direction trend reversal or when it continuing in it's previous direction (trend continuation), traders can use this as opportunities to enter the market by following the trend. After knowing this, traders should also know that by using the Elliot theory is the best method when trading with trend trading because this theory usually have a retracement using volume.
So traders usually take advantage of the correctness c line to enter long positions when they find out that it's greater than the a-line and the volume usually confirmed this because we see volume a to be greater than the other volume.
In a scenario, traders usually take advantage of the correctness c line to enter short positions in the market when they find out that it's less than the a-line and the volume usually confirmed this because we see volume a to also less than the other volume.
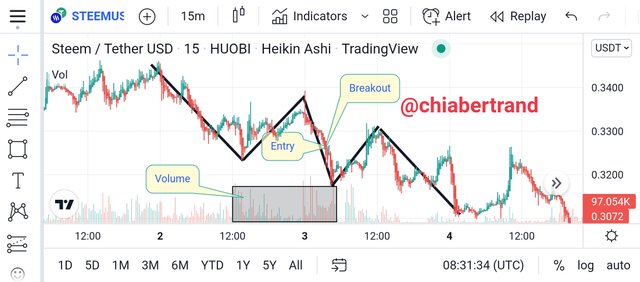
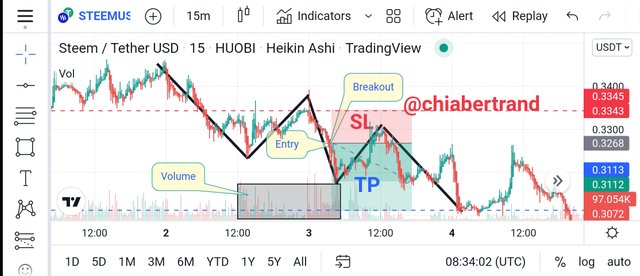
From the STEEMUSDT chart above, we see that emmidiately after plotting the Elliot wave, we can see how the market had broken line-c. Emmidiately this line was broken, I took advantage and entered a short position by placing proper stoploss and takeprofit as my stoploss was placed somewhere above the previous line-c low. My risk to reward ratio was set at R:R = 1 : 2

7. Open a live trade where you use at least one of the methods explained in the class. (Screenshots of the verified account are required.)
I will be using my own knowledge which I learned from my professors lectures so that I can be able to carry out effectively a good technical analysis by using tradingview.com. I will perform my long order in my verified Binance account

I started by following the trend movement after which I later found out that the current trend was a bearish trend but I also saw that they was a pull back in price after a revive outward bearish movement.
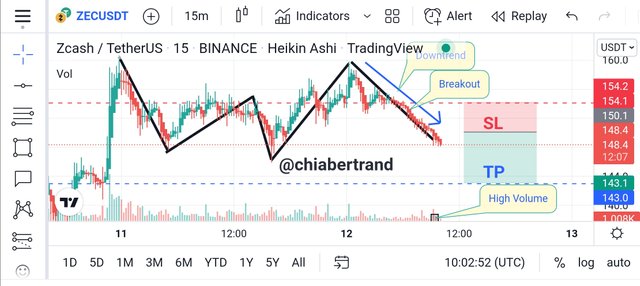
I then followed closely the law of demand and supply and saw that after the pullback, price had closed below the previous low which resulted to a breakout. After the breakout, it was showing that the price will continue downtrend movement because on using the volume to confirm, I also discovered that they was high volume hence futher confirming the continuation of bearish movement as the bearish engulfed candle was closing below the support zone. At this point I had to take an advantage to execute a short order
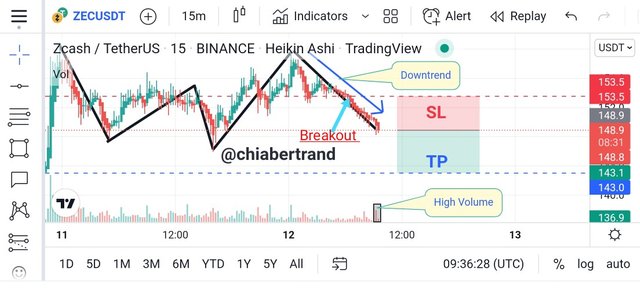
After the confirmation of a bearish engulfing candle as it was form on the upper timeframe, which tells me that there was high selling pressure as the price was moving downtrend, i then enter my verified Binance then executed my short order which i choosed future trading. My entry was at 148.86 with my takeprofit at 143.30and my stoploss at 153.00. My Risk to reward ratio was R:R = 1:2 as seen from the screenshot below
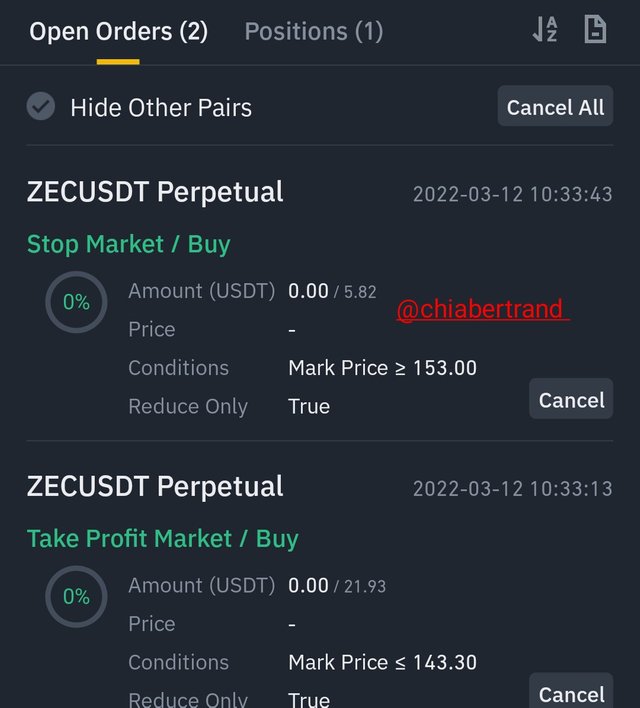
The screenshot above shows the entry and exit points
I then waited patiently for about an 30-mins then started experiencing progress as my trade was moving towards it's takeprofit point
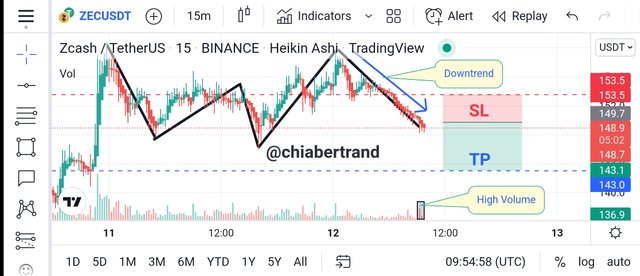
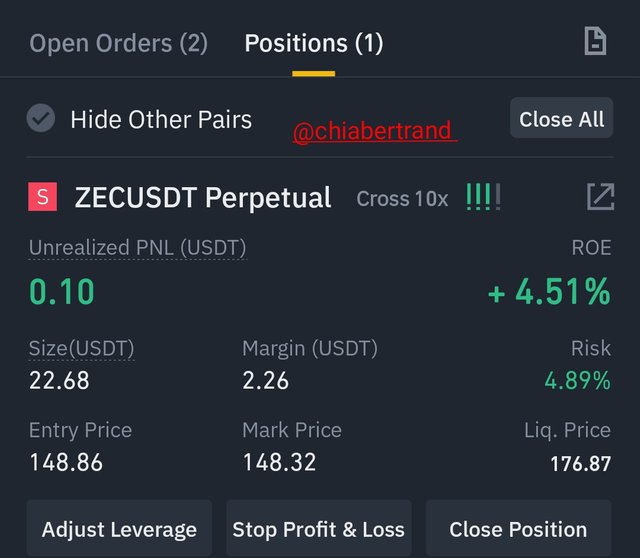
The screenshot above shows the progress of my trade
I had to be patient enough as i still waited for about an 30-mins when my trade hit a certain target which I secured a profit of $0.11 with a profit percentage of 5.26% as seen below
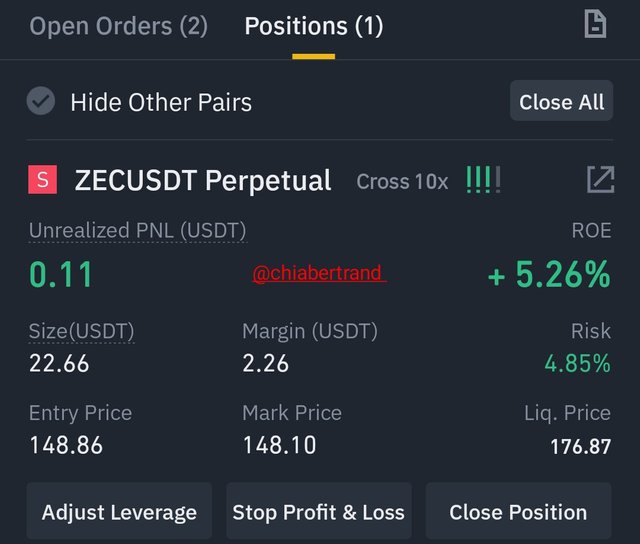
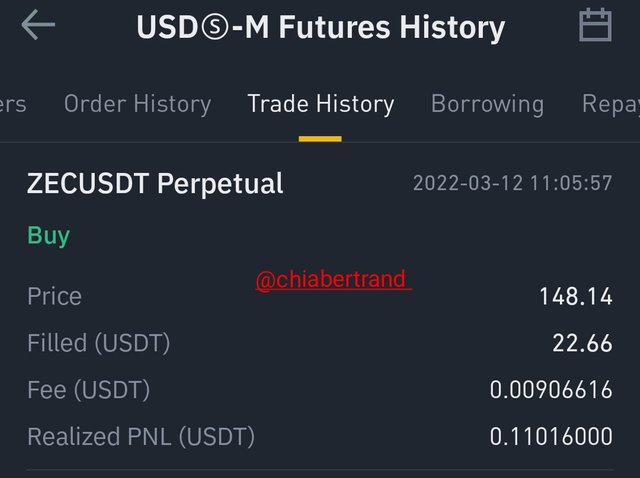


So far, I have had a better understanding about charts, candlestick and time frames after going through the professor's work and carrying out futher research. Also explained how to successfully identify both support and resistance levels on a chart and how to identify both Fibonacci retracement flags, accumulation/distribution, high volume and round numbers then how to correctly identify a breakout and a rebound and what a false breakout is
In the practical part, I was able to study the movement of the chart then use Elliot Waves theory to predict the direction of ZECUSDT price and I successfully placed a sell short order which went according to my prediction as I took home a profit of $0.11 with a percentage increase of 5.26%
Thanks so much Professor @nane15 for this wanderfull and beautiful lectures because I have been able to grabbed so much knowledge on the basics to trade cryptocurrencies correctly
CC
@nane15