 image edited on PixelLab

1a) Explain the Japanese candlestick chart? (Original screenshot required).
b) In your own words, explain why the Japanese Candlestick chart is the most used in the financial market.
c) Describe a bullish and a bearish candle. Also, explain its anatomy. (Original screenshot required)

1a) Explain the Japanese candlestick chart? (Original screenshot required).
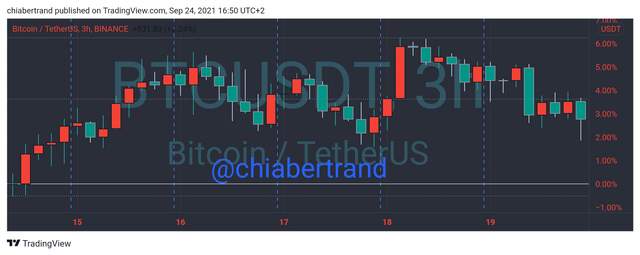
A Japanese candlestick chart simply show traders how Prices of assets or commodities are fluctuating in the market in a candle-like shape for easy understanding by traders.

This Japanese Candlesticks are always form as as result of the interaction of both buyers and sellers of a particular commodity and it is always made up of four main parts namely Open, Close, Low and High price . Below is an image showing clearly the four main part

In the early 1700s, a trader called Homma brought up this idea of Developing a Candlestick because he saw how traders emotions use to influence the price of rice in the market. So he Developed a Candlestick so as to graphically demonstrate how the prices move in the market by differentiating it with different colors, popularly Green and Red colors so that traders could use the Candlestick to identify the different patterns of price movement in the market and this price movement of assets always occurs at different periods of time. It can be from seconds right up to days, weeks or months

b) In your own words, explain why the Japanese Candlestick chart is the most used in the financial market.
The Japanese candlestick Is extremely very easy to use by traders because it is very accurate and provide more information about the movement of prices in the market. This price movement of assets is usually presented graphically to demonstrate the demand and supply to traders and it can be easily interpreted by them at any period of time on the chart
It is also most use in financial market because it is easy interpreted by traders due to its colors it possesses. It is usually made up of two colors which one color always represent a positive price movement while the other color is the reversal as it always represent a negative price movement in the market

c) Describe a bullish and a bearish candle. Also, explain its anatomy. (Original screenshot required)


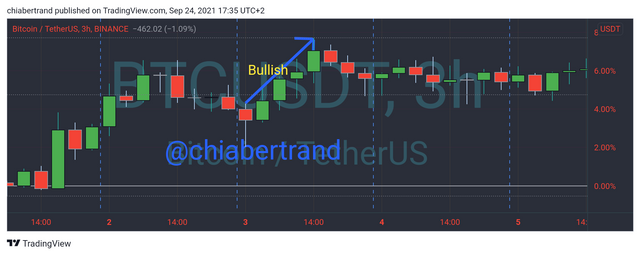
Bullish Candle always show how price movement of assets increases over time time in the market and this Candle always indicate both close and high price at the top of the candlestick then open and low price below the Candlestick.
This Bullish Candle is oftenly represented as Green color. However, traders can still change it to their desire colors but it's default settings always show but green color. This Candlestick always represent a positive price movement of assets in the market


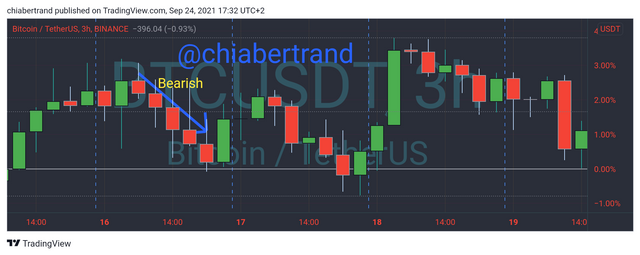
Bearish Candle always show how price movement of assets decrease over time time in the market and this Candle always indicate both open and high price at the top of the candlestick then close and low price below the Candlestick.
This Bearish Candle is oftenly represented as Red color on the chart. However, traders can still change it to their desire colors but it's default settings always show but Red color. This Candlestick always represent a negative price movement of assets in the market


After studying Candlestick pattern, we can come in conclusion that a Bearish Candlestick and bullish Candlestick are antagonistic and price reversal because when ever price of an asset is moving in an Uptrend, it form a Bullish movement then it will definitely also move back down to form a Bearish movement. Prices will always move like this in the market by indicating positive or negative outcome of assets
Thanks so much profesor @reminiscence01 for this beautiful lessons on Candlestick pattern because i have learned so much.