
QUESTION 1
What do you mean by global in/out of the money? How is a cluster formed? Explain itm, atm otm with examples

Global in/out of the money
The global in/out of the money is known to be on-chain metric in providing macroeconomic view particularly for accumulation of crypto asset as well as volume flow.
The main data used by the global in/out of the money is that of unspent balance of addresses and the purchase price point. Going now to the fact that the Global in/out of the money which I will be abbreviating as GIOM uses clusters in the determination of unchain data, we see that cluster ranges are brought about from cluster price range which is given by the minimum and the maximum price, and we also have the total volume, the average price and concluding with the number of address in the cluster.
The clusters are formed by grouping the addresses together in a defined period.
This is done by collecting purchase price data for different accounts and then associating them in groups of relatively close price.
Let’s then take a view of the GIOM cluster chart of bitcoin.
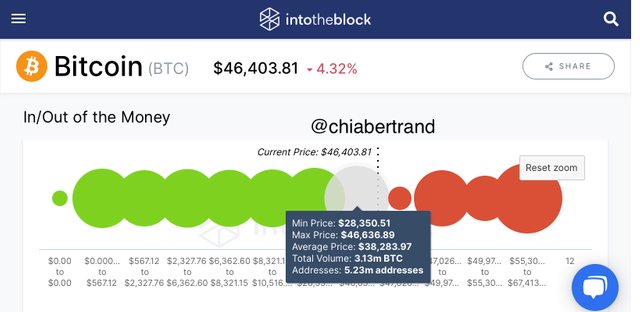
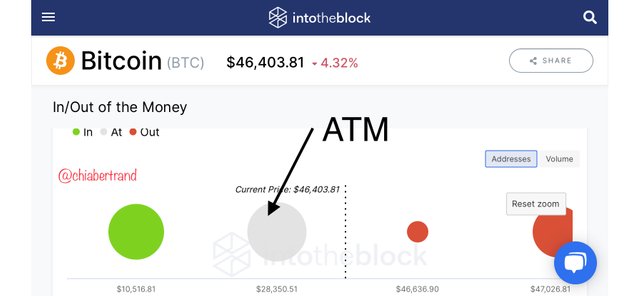
On the screenshot below representing the global in/out of the money clusters for bitcoin, the green color represents the In the money, the white color represents the At the money, and the red color represents the Out of the money
Form the white cluster above; we see that we have a minimum price of $28350 and maximum price of $46630, giving an average price of $38283. The total trading volume is 3.13m btc with 5.23m addresses.
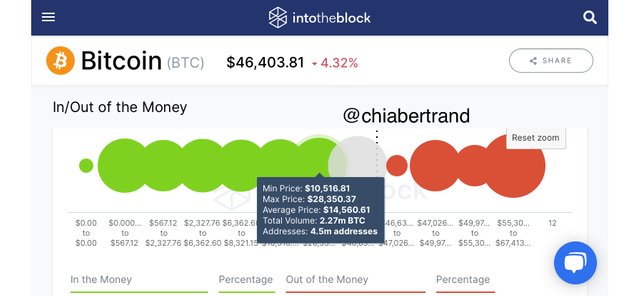
Lets now take a cluster for in the money, here as seen below; we have a minimum price of $10,516 with a maximum price of $28350 giving an average price of $14560. The total trading volume is 2.27m btc with 4.5 million addresses.
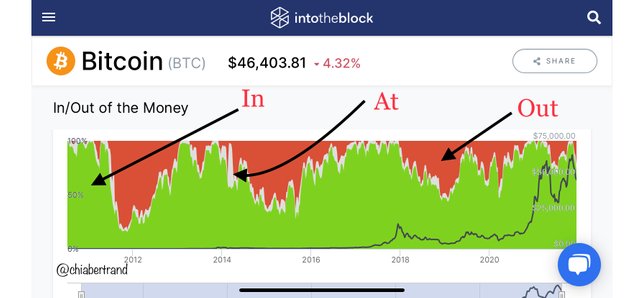
Showing the clusters with its different colors we can see as shown below. With each of the colors labeled,
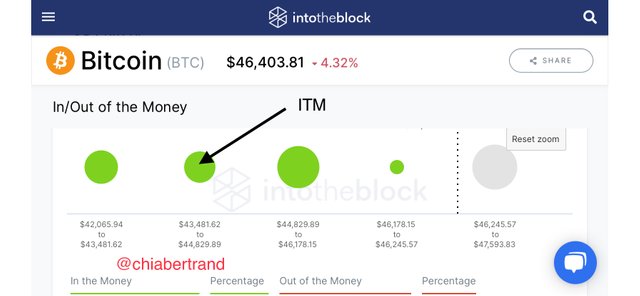
- The In the money abbreviated ITM is shown by the green cluster
- The At the money abbreviated ATM is shown by the white cluster
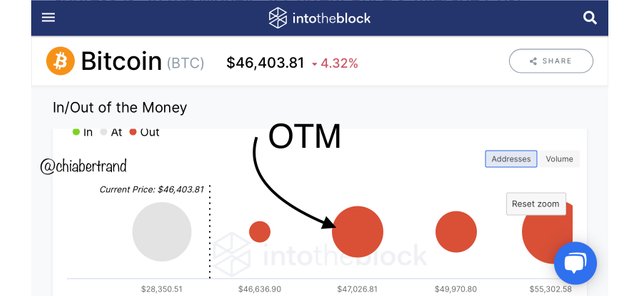
- The Out of the money abbreviated OTM is shown by the red cluster
I will then explain each of the clusters below;
A) In the Money (ITM)
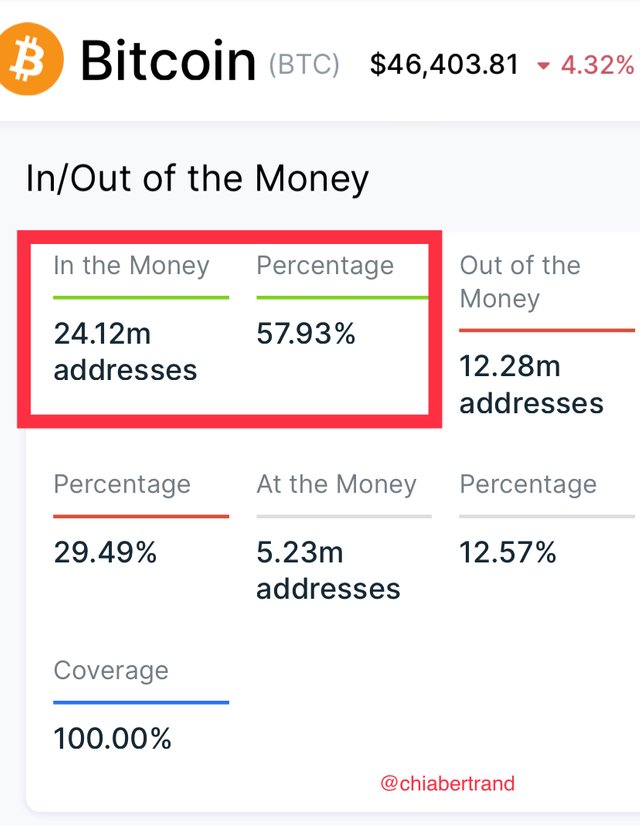
Beginning with the in the money which is abbreviated ITM, the ITM is known to occur the current prices of asset to be higher to be higher than the cluster price range. In this case, we see that the token held addresses in the clusters are assumed to be in profit. The cluster for the In the money are represented by the green color. We then see that the impact of the prices determines valid support levels for the bullish phase of that asset.
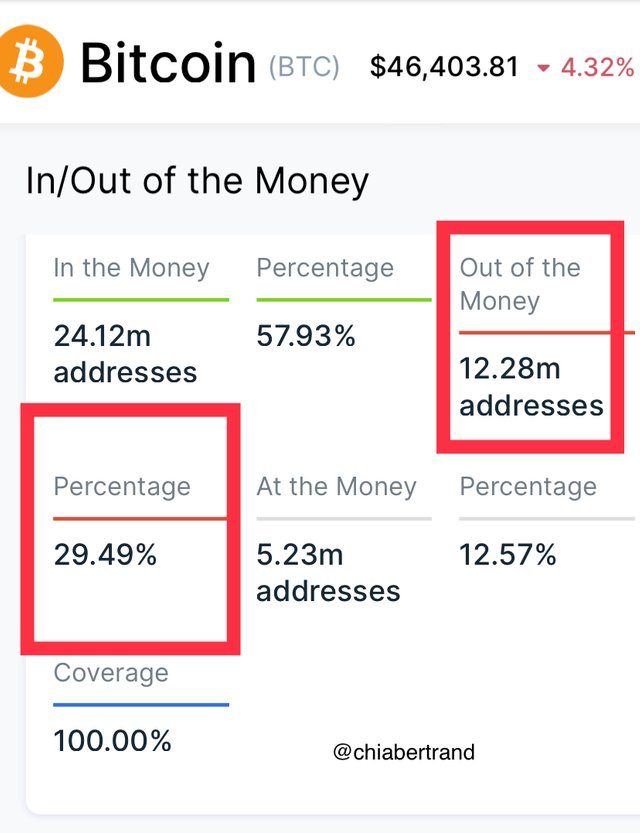
From the data obtained as seen above, we have 24.12 million addresses under the ITM clusters giving a percentage of 57.93% when compared to the others. With this high percentage, we see that does support the overall bullish nature of the bitcoin since its birth.
B) At the Money (ATM)
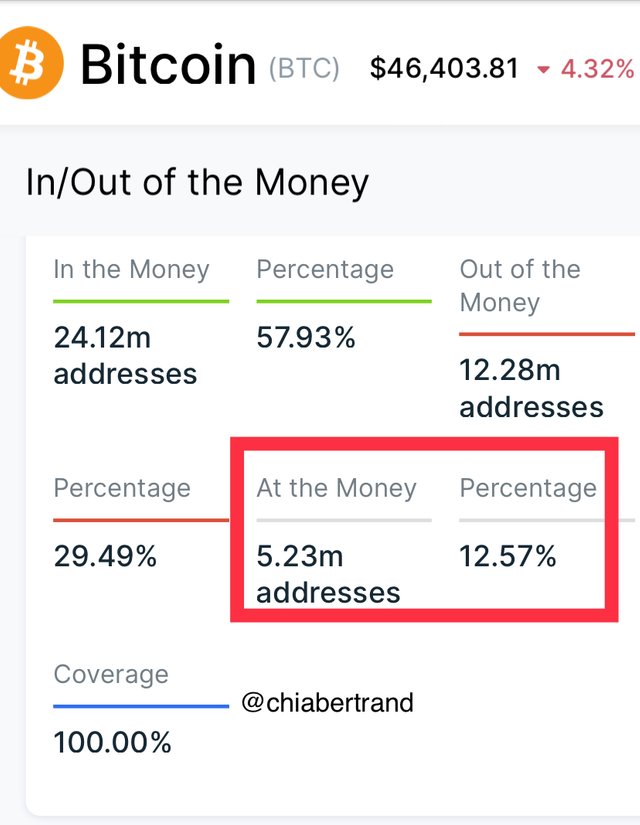
We have next is the ATM. The At the Money is known to happen when we have the prices of an asset to be equal to the cluster price range. With this, we can assume that the token held addresses in the clusters can be said to be breakeven as we have no profits or losses.
The clusters for the ATM are represented by the white color and we can see them below.
From the data, we see that 5.23 million addresses with a percentage of 12.57% when compared to the others for the overall btc holdings
C) Out of the Money (OTM)
I will then conclude with the Out of the Money, which is represented by the red clusters. The OTM is known to happen when we have the current price of an asset to be lower then the cluster price range. When checked, we see it is actually the opposite of the in the money as explained earlier above.
With this, there is an indication that the token held address in the clusters are assumed to be negative. In this regard we see the out of the money clusters to act as resistance levels specifically for the bearish continuation of the prices.
From the obtained data, we have 12.28 million addresses for the out of money which represents a percentage of 29.49% since the birth of bitcoin. The In the money abbreviated ITM is shown by the green cluster

QUESTION 2
Explain about large transaction volume indicate with examples? What is the difference between total and adjusted large transaction volume. Examples

Large Transactions Volume
The large transaction volume is an important aspect in the on-chain metric analysis. The large transaction volume does play a great role in the movement of prices in the market.
In this regard, we will be using the large transaction indicator to determine the various records of large transactions in a particular asset. The large transaction volume is therefore noted to be an on-chain indicator which is used particularly for recording large transactions of a particular crypto asset. this large transactions are transactions which are greater than or equal to $100,000 (>= $100,000).
Also for the occurrence of such transactions, it is always noted to either come from whales’ transactions or large financial institutions.
We all know of the whales cycle in the market how it brings about significant bullish trend when they just enter their positions and how it brings about significant fall in the prices of that asset when the whales goes out of his position.
It is actually the same thing happening here. When a whale or a financial institution enters their positions, we see a great in the large transaction volume indicator.
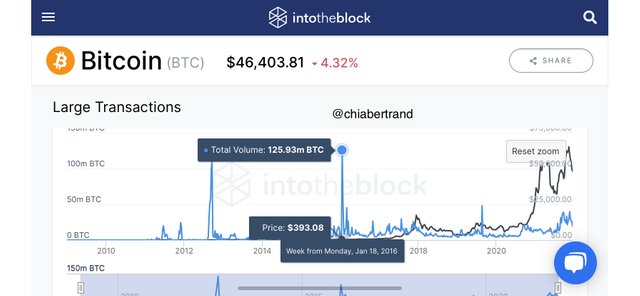
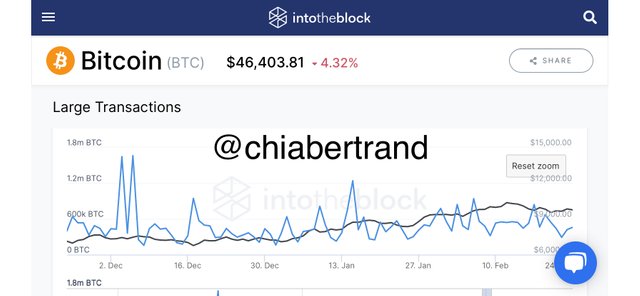
The screenshot above shows an example of a large transaction volume which happened on the week from Monday 18, January 2016. There was a total of 125.93 million btc which was transacted with a price of $393 per btc. With the calculations, we had about $49 billion transacted which led to the strong bullish trend met up till date.
Differences between total and adjusted large transaction volume
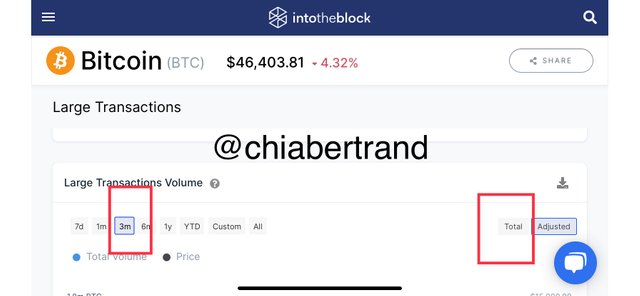
With the total large transaction volume, we see that there is no consideration if the volume transacted is done out of and back into the same the wallet. With this total large transaction, it records transactions involving a single address. With these recordings, we notice that we will have the generation of false signals which is principally because transactions are made from an address and transferred back to that same address.
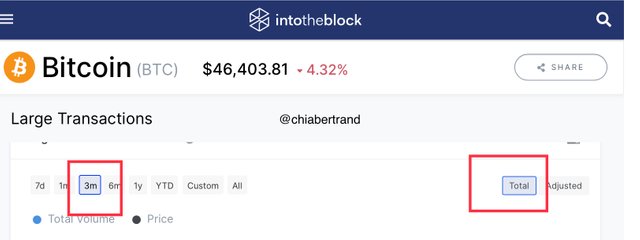
We can see in the screenshot below as the indicator is set to 3 months and total large transactions volume as the indicator presents a lot of randomness.
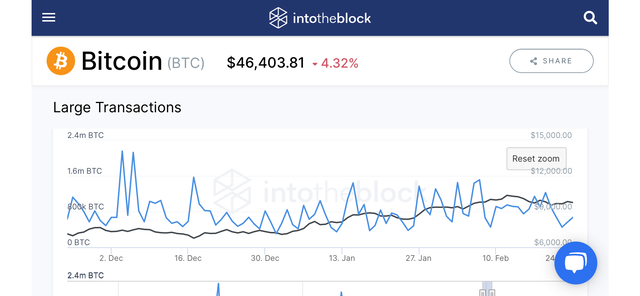
Now going to the adjusted large transaction, we have filtering of transactions done within the same the same wallet address. With this, we see that we will have lesser spikes and the elimination of false signals. In the screenshot presented below is the chat adjusted to 3 months and as seen we have lesser spikes as compared to above.

QUESTION 3
Analyze a crypto asset using on-chain metric; GIOM, and adjusted large transaction volume? Ascertain whether it supports a bullish or bearish bias or neutral? How do you find the support and resistance using GIOM? How do you ascertain the upside/downside momentum using GIOM? Use intotheblock app or any suitable app

Analysing Litcoin using GIOM
Beginning with the Global in/out of the money to analyse the litcoin cryptocurrency, the litcoin has a current price of $148 with a 1.7% rise in the last 24 hours.

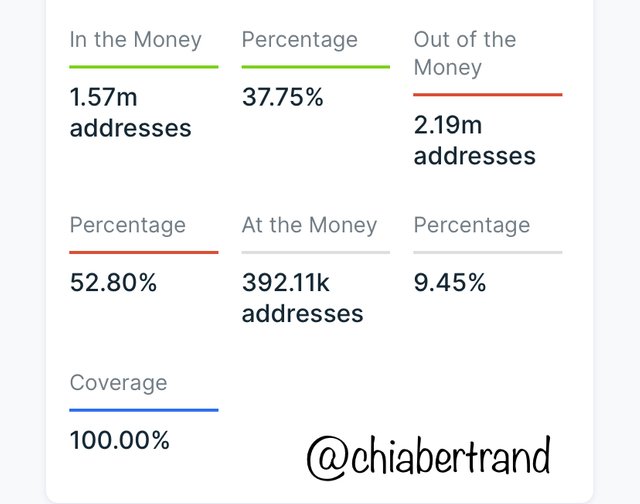
The litcoin has the following data;
In the Money
- 1.57 million addresses with a 37.75% in the overall 100% coverage
Out of the Money
- 2.19 million addresses with a 52.8% in the overall 100% coverage
At the Money
- 392.11 thousand addresses with a 9.45% in the overall 100% coverage
From this we can see that the balance fall on the side of out of the money.
It is now the perfect time to find the relative support and resistance zones. Just as explained earlier above, w have the green clusters representing the in the money, the white clusters representing the at the money and finally the red clusters representing the out of the money.
Long Term
For the long term scenario, we will identify the addresses currently holding the litcoin. As explained earlier above, we have 1.57 million addresses with a 37.755 for In the Money, a 2.19 million addresses with a 52.8% for out of the money and finally a 392.11K addresses with 9.45%.
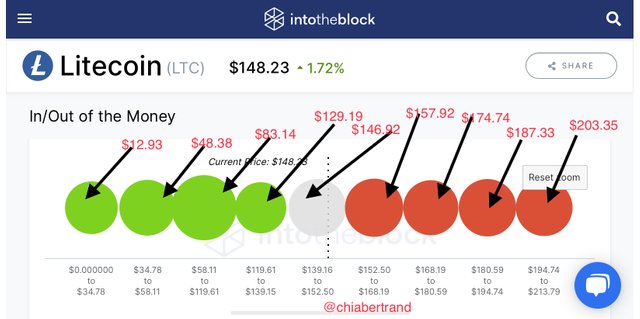
The average price for each of the clusters are as shown below
From the above data, we see that the best resistance level is at the $157.92 level, with the next being at the $174.75 level.
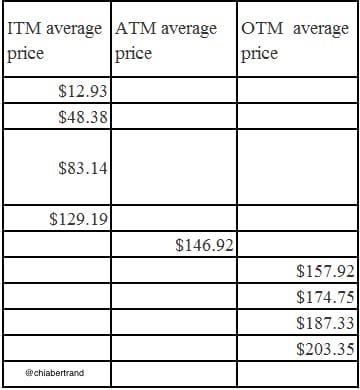
image made from excel
The best support level is at the $129.19 level.
With this, when compare the volumes of the immediate support and the immediate supports, we see that the volume of the immediate resistance is greater with a value of 7.34 million lite compared to the 3.3 million litcoin which further supports the bearish trend of the crypto.
Short Term
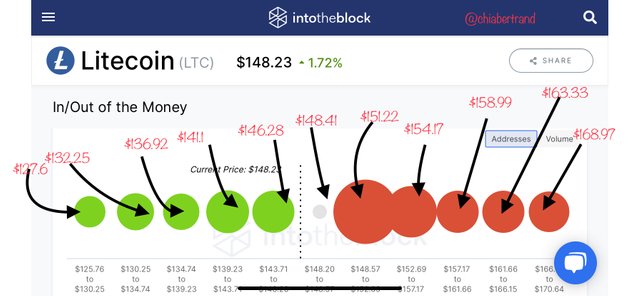
For the short term scenario, we will nr identifying the addresses currently holding the litcoin. we have 391.17K addresses with a 36.67% for In the Money, a 640.24K addresses with a 60% for out of the money and finally a 35.36K addresses with 3.31% for a coverage of 25.72% from $125.76 to $170.64
The average price for each of the clusters are as below
From the above date, we see that the best resistance level is at the $151.22 level, with the next being at the $154.17 level.
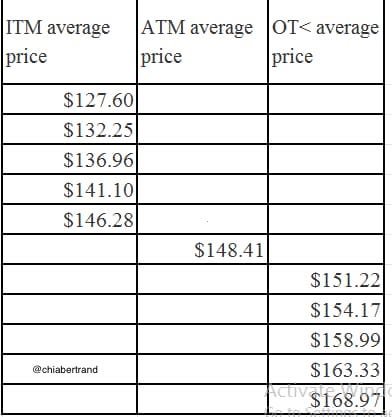 image made from excel
The best support level is at the $146.28 level.
With this, when compare the volumes of the immediate support and the immediate resistance, we see that the volume of the immediate resistance is greater with a volume of 7.49 million lite compared to the 2.23 million litcoin which further supports the bearish trend of the litcoin just as in the long term.
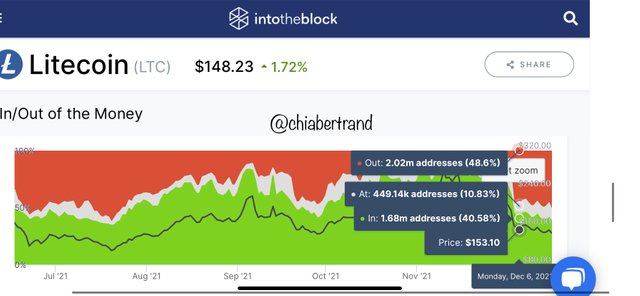
Using the historical in/out of the money, I will be doing my analyses for the past 6 months which is from the month of July to date. The colors as earlier explained above still remains the same. The green represents the, in the money, the red; out of the money while the white represents; at the money.
My reference point is set at Monday, 6 december; here we have the price at $153
- 2.02 million addresses with a percentage of 48.6% for; out of the money
- 449.14K addresses with a percentage of 10.83% for; at the money
- And we have 1.68 million addresses with a percentage of 40.58% for; in the money
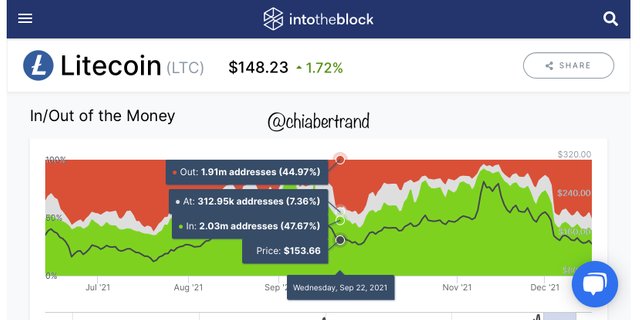
Now comparing with a period that has a similar price range, is that of Wednesday 22, September 2021. We also have the prices at $153
Taking the GIOM data, we have;
- 1.91 million addresses with a percentage of 44.96% for; out of the money
- 312.95K addresses with a percentage of 7.36% for; at the money
- And we have 1.68 million addresses with a percentage of 47.67% for; in the money
For the interpretation, we have the seen a decrease in the number in the percentages for; in the money as well as the; out of the money from 10.83 to 7.36 and 48.6 to 44.97% respectively.
We can then explain that the momentum is accompanied by the bearish trend of litecoin.
Analyzing Litcoin using adjusted transaction of Large Volume
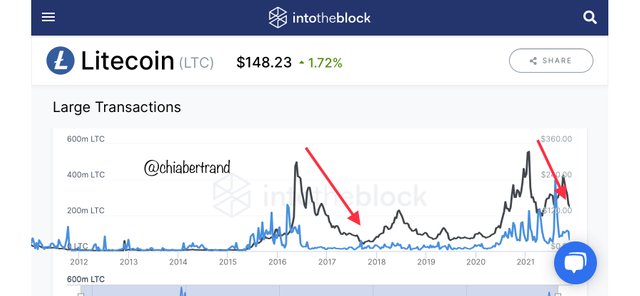
Beginning by setting the chart to adjusted large transaction volume, I will begin by giving an analyses on the all-time of the litecoin.
Since the creation of the litecoin in 2012, the second highest number of large transaction occurred in the week of Monday December 11, 2017.
This was shown by the price of $284.84 with a number of large transactions being 47.14K.
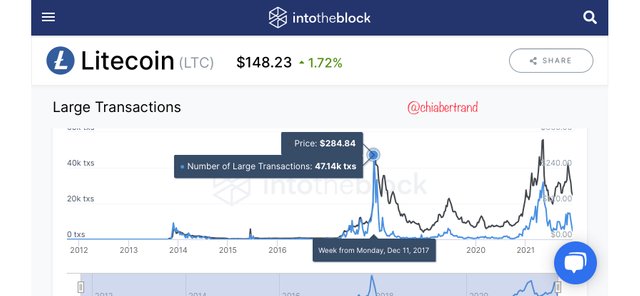 screenshot from intotheblock screenshot from intotheblock
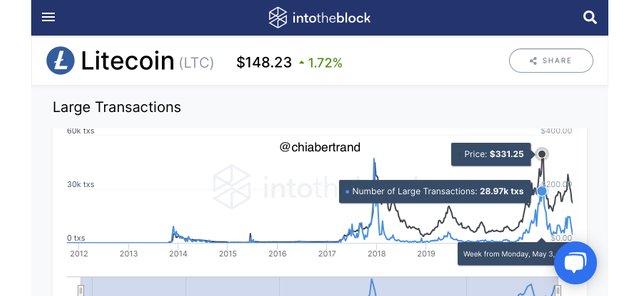
The highest was found this year in the month of May, particularly the 13th with a price of $331 and 28.97K large transactions. We can see that in the screenshot below.
In both scenarios, we have seen the fall in the prices of the litecoin after such high peaks made. This can then be match to the activity of whales and large financial institutions trading volumes larger than $100,000 which can be explained by the whales cycle.
Conclusion
I have explained the global in/out of the money and how the clusters are formed which is an on-chain metric which shows the number of addresses owned by a particular asset. It is separated into different clusters which are the in the money, at the money and out of the money.
I have also explained on the large transaction volume indicator which indicates transactions that are being carried out for over $100,000 particularly by the activity of whales.
Thanks so much Professor @sapwood for this wanderfull and beautiful lectures because I have been able to grabbed so much knowledge from this Onchan Metrics parr-3
CC:
@sapwood
