
Hi guys welcome to my homework proper on week 1 season 5 beginners course. I will be discussing about the Donchain channel indicator and how traders use it for their trading strategies in order to take advantage of financial markets. Without wasting your time, let’s hit on with it.

Question1:
Explain and define in your own words what the Donchian Channels are?
The Donchain channel is a trading indicator used as a straight forward tool for measuring asset volatility. This indicator is as old as the 1950s where it was introduce by “the father of trends” known as Richard Donchain. This trading indicator was named after this futures trader who saw the need to get an indicator that shows both the trend breakout; volatility; and oversold/overbought market conditions in one place. Therefore the Donchain channels indicator is made up of the price volatility and potential overbought/oversold market areas.
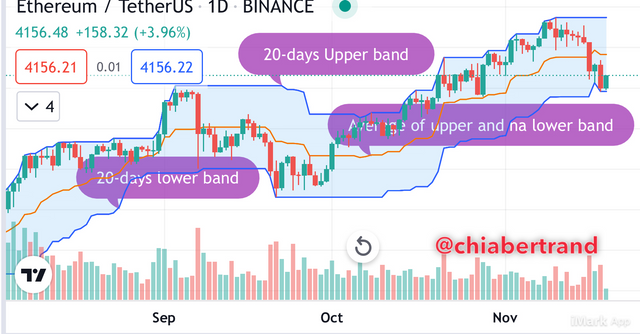
This indicator consists of three bands brought to work by moving average calculations. This bands includes the upper bands (highest price security) and lower bands (lowest price security) together with a mid-range band that constitutes the central part of this indicator. This central part (mid-Range band) is the average of the upper and lower bands.
The Donchain channels can be determined on specific time periods depending on the trader. Therefor this indicator can be applied on a variety of assets and different time intervals (Weekly, hourly, and even within minutes charts). This indicator can be confused for the Bollinger Bands. However, it is more preferable as it’s easier to apply and interpret.
Summarily, the Donchain channels are utilized by traders to understand trend periods in the market in different time periods. It utilizes a default 20 bars of candlesticks. This allows traders to use longer Donchain channels or limited once as provided by different trading platforms as this indicator is readily available in different trading platforms. This indicator makes identifying bearish and bullish market trends very easy throughout the timeframe. Traders use this indicator as a measure of market instability and price breakout identifier.
ETH/USDT source

Question 2:
Explain in detail how Donchian Channels are calculated (without copying and pasting from the internet)?
Like I indicated above, the simplicity of the Donchain channels makes it widely applicable. The calculation of this indicator is done in a straightforward manner and very simple such that even beginner traders can determine it easily.
Firstly, the calculation will depend on the periods preference taken by the trader. Most traders make use of the 20-days timeframe for example. With this period (20-days) we can calculate in the following manner.
Upper channel (band) - 20-days high
Mid-range (middle band) - [20-days high plus 20-days low] all divided by 2
Lower channel (band) - 20-days low
As smple as it is, you take the highest price on the upper channel and the lowest price for the lower channel at the given timeframe you chooses. The average of these two is the mid-range which constitutes the central channel. After these considerations, you plot th on a price chart of the asset you are to trade on.
So in very simple terms we can say that the Donchain channel (DC) can be calculated by;
DC = (HH + LH) / 2
Where;
HH= upper channel price
LH=lower channe price
DC=Donchain channel
With all these done on the preferred time period the trader wants to trade the asset on.
Looking at this calculation, we can conclude that the Donchain channel is an average of the lower and upper bands under a a preferred time period.
It should be noted that the timeframe chosen for the analysis is the timeframe that will be used in making a trade with the tested asset.

Question 3:
Explain the different types of uses and interpretations of Donchian Channels (With examples of bullish and bearish trades)?
Like I described this indicator above, I will like to bring it up again before we get into this part. This indicator is that which identifies trends in the market by the utility of three different bands: the lower, upper and mid-range bands. This indicator can be used to identify market trend breakouts, volatility and reversals and also overbought/oversold market conditions.
The Donchain channels have been used for breakout strategies, reversal strategies, and as pullbacks strategies. All of these can involve both bullish and bearish market structure.
The following are uses and methods of interpretation of the Donchain channel indicator.
Donchain Breakout Trading Strategy
Since the Donchain channel is a trend type indicator, it’s easy to spot breakouts using this indicator. The upper and lower band should always be observed by the trader using this strategy in order to quickly identify any drastic behavior in price movement. When applied on short and medium term intervals, this strategy becomes more effective. When price is trading higher than the Donchain channel (mid-range) traders can take long positions and when it is trading below the Donchain channel, they can take short positions.
To carry this out successfully, a trader needs to identify the existing market trend of the crypto asset. They can now open a position depending on the area of the Donchain channel that the asset is trading like I mentioned on the previous paragraph. The goal here is to catch the next breakout. Breakouts mostly takes place when prices does not consider an opposite movement towards the mid-range (middle band). If the price continuously touchés both upper and lower bands, therefore the asset has been trading in its lows/highs hence a consolidation.
A breakout can either be bullish or bearish. But breakout systems are expressed below.

Bullish breakout
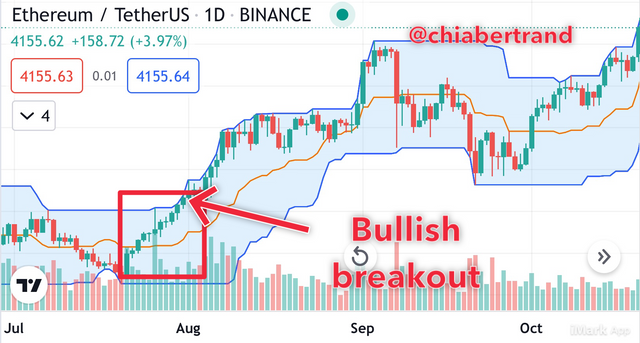
The bullish breakout occurs when the prices breaks into the upper bands. If such situations occur, it is considered that the market is trading at an overbought zone.
ETH/USDT Source

Bearish breakout
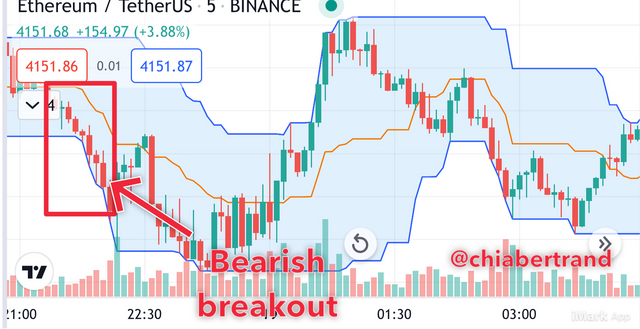
This occurs when prices trade below the mid-range towards the lower band. When prices breaks into the lower band, it’s is considered that the asset is trading at an oversold zone hence a bearish breakout.
ETH/USDT Source
Knowing the breakout positions, traders also use candle sticks to identify when to take a position on either breakouts. Or an average consideration, two candles touching the bands consecutively is enough to be considered a breakout signal and positions can be taken on long (for bullish breakouts) or short positions (for bearish breakouts).
However it should be noted that indicators have their flaws and so is the Donchain channel. To be on a safe side, traders prefer to wait for a price close consistently below the lower band or above the upper band. For better results, one should employ the use of other indicators as supplements for the Donchain channel indicator.

Donchain Reversal Trading Strategy
Here a trader is expected to keep close watch of the mid-range (middle band). Catching reversals are of great interest to traders of the financial market. To apply Donchain channel for reversal indication, a trader has to be patient enough to wait until there’s a reversal in the price movement. Once this reversal takes a steady trend on the other direction, traders can open positions which will depend on the new trend direction as to whether long or short. When price breaks the middle band upward, it is considered a buy long position signal and the reverse is a sell short signal.
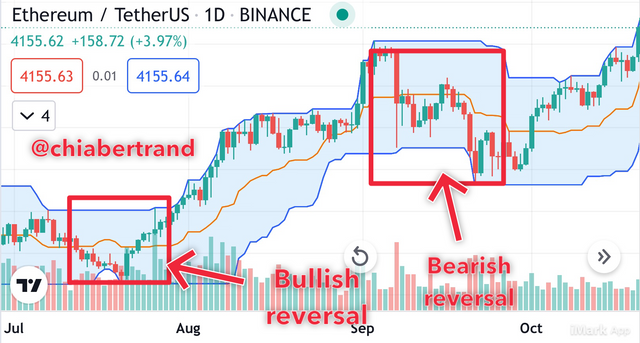
ETH/USDT Source

Donchain Pullback Trading Strategy
This strategy is applicable mostly for such term purposes. Here close looks are also focused on the mid-range. When prices hit but are unable to break the mid-range to the lower or upper bands, it is considered a pullback signal. This means that when prices hit the mid-range but couldn’t break into the lower band we have a bullish pullback signal and the reverse is true.
Like I said above, it is always safer to add different indicators to your strategy
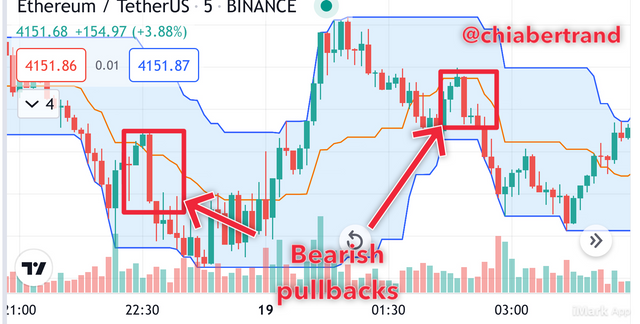
ETH/USDT Bearish pullback signal Source
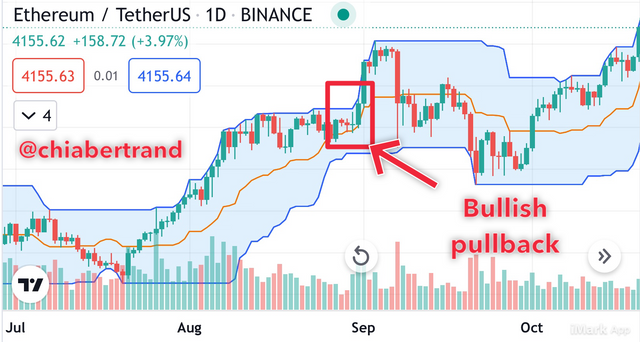
ETH/USDT Bullish pullback signal Source

Practice (Remember to use your own images and put your username)
Question1:
Make 1 inning using the "Donchian Channel Breakout Strategy" and make 1 inning using the "Reversal and Retracement Strategy" . You must explain the step by step of how you analyzed to take your entry and make them into a demo account so I can evaluate how the operation was taken
Here I will carry out a trading analysis using the Donchain channel indicator for price breakout signals. I will use my account on tradingview.com to carry out this activity. The following steps best describes how I carried out this analysis.

Reversal and retracement strategies
Step 1:
I visited the trading view site and login to my account. I took cryptocurrency chart and selected ETH/USDT pair for my analysis. The indicator I will be using is the Donchain channel indicator for this analysis. My indicator settings were carried out as seen on the following screenshots
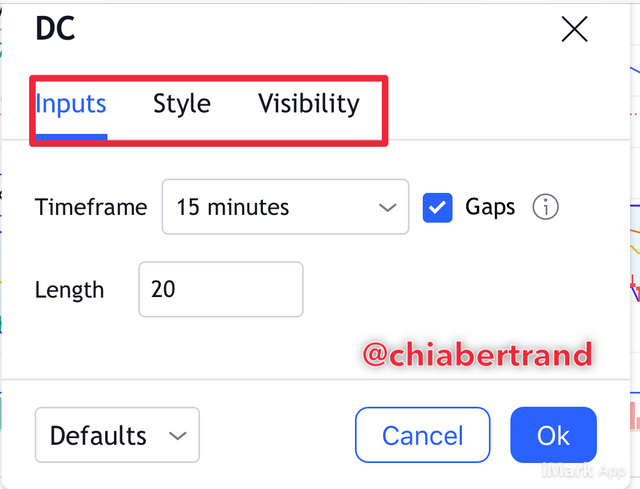
ETH/USDT Source
Step2:
I took a long position when market price movement signaled a reversal by two candles successfully touching the lower band and started a reversal at 4294.60$.
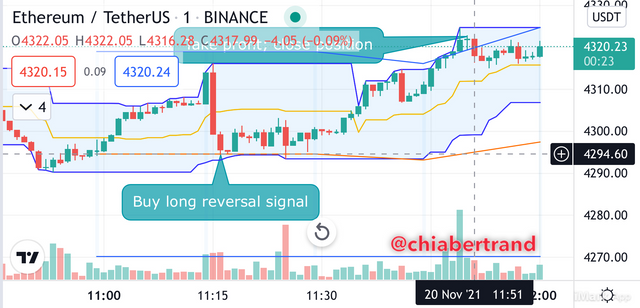
ETH/USDT Source
Step3:
I used the above entry point and set my take profit at close to the previous upper band which was at 4310$. Abs you can see my trade went successfully up to 4322$
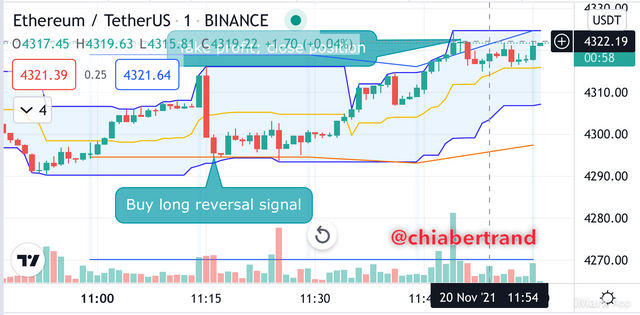
ETH/USDT Source
The above steps show how I carried out Donchain channel analysis and in order to place my trade in my Binance account.

Breakout strategy
After carrying out the first step I described above, I proceeded with an eye on the mid-band like I expressed on price breakouts above.
Step 1:
when I identify candlesticks breaking into the upper or lower band, that’s crossing the mid-range band, I immediately get it as a signal to either buy long or sell short. This token around, the price break through the mid-range band and I took my entry at 4233.60$
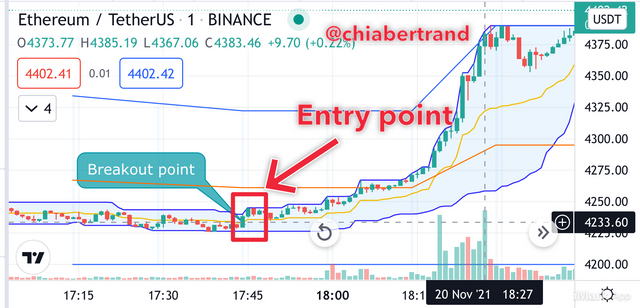
ETH/USDT Source
Step 2
Takin get profit at 4318$ as seen on the screenshot below.
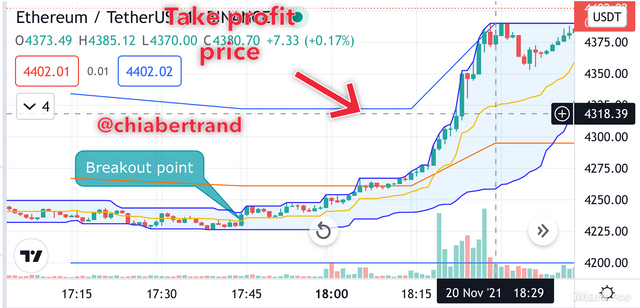
ETH/USDT Source

The Donchain channel together with other indicators such as RSI will enable traders make good trading decisions. An all in one indicator, that is what I call the Donchain channel indicator. This is because this indicator gives good signals upon breakout sessions in market prices in bothers extremes and within a mid-range.
Thanks to my professor for such a wonderful lesson. I must say I heard of Donchain some time ago but from this lesson and assignment I have learned how to ya it it very well.
Unless otherwise stated, It should be noted that all screenshots are gotten from tradingview.com ETH/USDT pair
CC:
@lenonmc21