
Question 1 - Explain your understanding with the median indicator
The median indicator is one of the many technical indicators that fall under the category of trend-based. When it comes to technical analysis and trading, indicators play a very important role in not only predicting price direction but also making effective trading decisions. Trend is a very important term when it comes to predicting price direction in a particular time period.
The median indicator is basically a technical indicator that can be used for the measurement of volatility and price direction in the market. The median indicator makes use of a channel that forms based on how the ATR value moves away from the middle of the range value within a selected period. Also, the parallel bands that is gotten from the average true range ATR value shows the price volatility. On the Average True Range ATR of the median indicator, the ATR is plotted above the median line and below the median line which is used for determining volatility of the price. The way the median indicator works is that it shows the median value of the average between the highs and the lows within the specified length and the median is compared to the exponential moving average EMA of the same period length.
On the median indicator, there is a coloured cloud which is basically the space or the difference between the median and the exponential moving average EMA, which shows depending on which has higher values. The coloured cloud on the median indicator visually represents the direction of the market in terms of uptrend and downtrend. When the cloud shows a green colour, it is an indication that the market is bullish and the median value is higher compared to the exponential moving average EMA. Also, when the cloud shows a purple colour, it is an indication that the market is bearish and the median value is lower compared to the exponential moving average EMA.
.png)
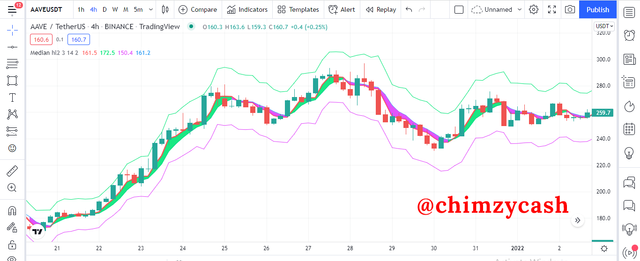
Median Indicator added on the AAVE/USDT chart on tradingview
Question 2 - Parameters and Calculations of Median indicator. (Screenshot required)
To explore the parameters of the median indicator, we need to first add it on a chart. To do this, I will be using the tradingview platform. Any charting platform that has the median indicator can be used. To add the median indicator on any chart on tradingview, click on indicators tab, and on the search, type median. After that, the median indicator will be available on the library. Select the first indicator with the name “median”. The median indicator is now added on the chart.
.png)
Median Indicator on tradingview
.png)
Median Indicator on tradingview
On the parameters, the main section is the input
Median length = this is basically the number of data points that is considered when the median is calculated. On the median indicator, the default input for the median length is 3, however, it can be changed based on the needs.
ATR length = On the ATR length, the number of period that is considered when calculating the median ATR. On the median indicator, the default input for the ATR length is 14, however, it can be changed based on the desired needs.
ATR Multiplier = this is basically the ATR multiplier which is the ATR value multiplied by the ATR in the emergence of the upper bands and lower bands. On the median indicator, the default input for the ATR multiplier is 2, however, it can be changed based on the desired needs.
MV = (HP + LP) / 2
Where;
MV = Median Value
HP = Highest Price
LP = Lowest Price
EMA V = CP x M + EMA (PP) x (1-M)
Where;
EMA = Exponential Moving Average
EMA V = Exponential Moving Average Value
CP = Closing Price
M = Multiplier
PP = Previous Period
UB = ML + (2ATR)
LB = ML - (2ATR)
Where;
UB = Upper Band
LB = Lower Band
ML = Median Length
ATR = Average True Range
From the screenshot of the median indicator settings, we can see the various parameters such as median length, ATR length and ATR multiplier which are very important parameters when using the median indicator. Depending on the technical analysis and trading strategy, the input parameters can be changed. However, it is important to know that changing the input parameters wrongly can provide false signals when using the indicator.
Question 3 - Uptrend from Median indicator
Identifying and Determining trends whether uptrend or downtrend is one of the main strengths of the median indicator as it is a trend-based indicator which is great for buy and sell signals. The cloud that is formed on the median indicator signals the trend direction in the market and changes colour based on the direction of the trend. For uptrend, the cloud changes to green color and the median value or median line is above the EMA value. This means that the market is bullish or moving in an uptrend direction and that the buyers have taken control of the market.
.png)
Median Indicator on tradingview
From the BNB/USDT chart, we can see the median indicator identifying the change in trend direction to the upside as the cloud colour changed from purple to green which is an indication that the buyers are about to take control of the market and the price is about to move in an uptrend direction. After the cloud colour changed from purple to green, we can see that what followed next is an uptrend price movement. Once this signal is identified, it becomes a good buy signal for a buy trade.
Question 4 - Downtrend from Median indicator
Identifying downtrend using the median indicator is what makes the median indicator such a powerful tool used during technical analysis for identifying trends in the market. As always, the median indicator is a trend-based indicator which is also great for sell signals. The cloud that is formed on the median indicator signals the trend direction in the market and changes colour based on the direction of the trend. For downtrend, the cloud changes to purple color and the median value or median line is below the EMA value. This means that the market is bearish or moving in a downtrend direction and that the sellers have taken control of the market.
.png)
Median Indicator on tradingview
From the BNB/USDT chart, we can see the median indicator identifying the change in trend direction to the downside as the cloud colour changed from green to purple which is an indication that the sellers are about to take control of the market and the price is about to move in a downtrend direction. After the cloud colour changed from green to purple, we can see that what followed next is a downtrend price movement. Once this signal is identified, it becomes a good sell signal for a sell trade.
Question 5 - Identifying fake Signals with Median indicator
When using the median indicator for buy and sell signals, it is important to know that it is not perfect and that there is no technical indicator that is 100% perfect and accurate in its signals, that is why it is always advisable to combine the median indicator with another indicator like the RSI or MACD for signal confirmation and filtering false signals. For this demonstration, I will be combining the median indicator with the RSI indicator for filtering out false signals. The RSI indicator is a momentum indicator that indicates when the price is overbought or oversold. This makes it a great indicator to combine with the median indicator for signal confirmation and identifying false signals.
.png)
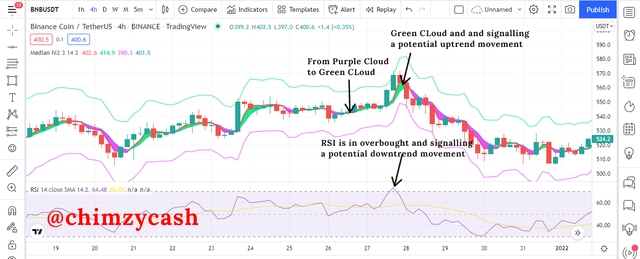
Median Indicator and RSI indicator on BNB/USDT chart on tradingview
On the BNB/USDT chart, we can see that the median indicator signaled that the price is about to be bullish and a potential uptrend movement as the median indicator cloud changed from purple to green. We see a couple of green candles. The RSI indicator helped to identify the false signal as the RSI value is above 70 and in overbought zone which means that the market is about to reverse in a downtrend direction. After that, we can see that the price went into a downtrend.
Question 6 - Open two demo trades, long and short, with the help of a median indicator or combination that includes a median indicator (screenshot required)
I will be making use of the median indicator in combination with the MACD for my buy and sell trades on the tradingview platform.
Buy Trade - AUDIO/USDT
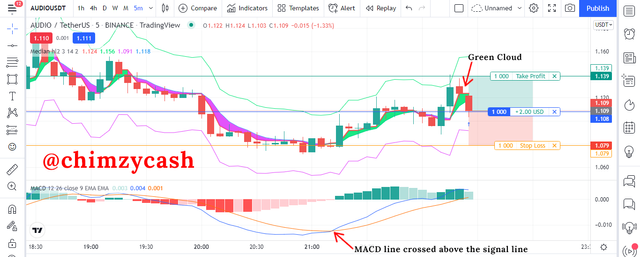
For the buy trade on the AUDIO/USDT on the 5 mins chart, the buy signal was identified after the median indicator formed a green cloud. On the MACD indicator, we can see that there is a bullish crossover as the MACD line crossed above the signal line making it a good buy signal. After the signal was identified, I placed a buy entry for AUDIO/USDT at 1.109 and using the 1:1 risk:reward ratio, I set my take profit at 1.139 and stoploss at 1.079.
Buy entry – 1.109
Take profit – 1.139
Stoploss – 1.079
.png)
Screenshot of my AUDIO/USDT buy trade on tradingview
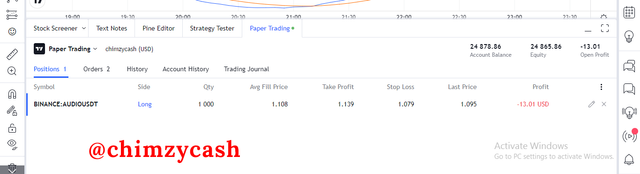
After placing the buy entry, my buy position is still running as my stoploss hasn’t triggered as I expect to make profit from my buy trade.
.png)
Screenshot of my AUDIO/USDT buy trade on tradingview
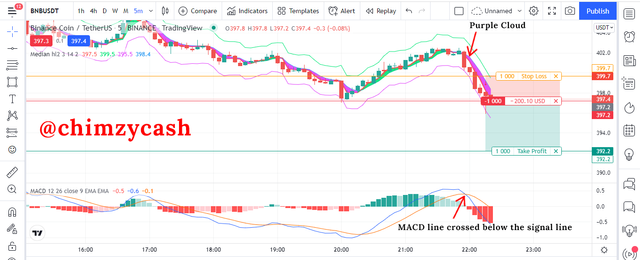
Sell Trade - BNB/USDT
For the buy trade on the BNB/USDT on the 5 mins chart, the sell signal was identified after the median indicator formed a purple cloud. On the MACD indicator, we can see that there is a bearish crossover as the MACD line crossed below the signal line making it a good sell signal. After the signal was identified, I placed a sell entry for BNB/USDT at 397.2 and using the 1:2 risk:reward ratio, I set my take profit at 392.2 and stoploss at 399.7.
Buy entry – 397.2
Take profit – 392.2
Stoploss – 399.7
.png)
Screenshot of my BNB/USDT sell trade on tradingview
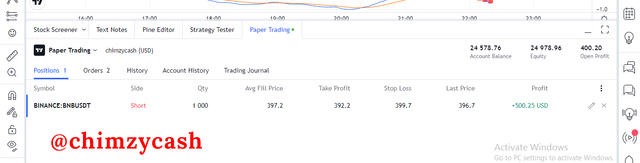
After placing the sell trade, I made a profit and closed my sell position on a profit.
.png)
Screenshot of my BNB/USDT sell trade on tradingview
Conclusion
The median indicator has shown that it is a very powerful and reliable trend-based indicator when it comes to identifying trend direction in the market and also giving out buy and sell signals for trading. However, the median indicator has proven to not be 100 percent accurate and perfect in its signals and as such, combining the median indicator with other technical indicators like RSI or MACD is a great way to filter out false signals on the chart and also for signal confirmation when it comes to trading any crypto asset.