Question 1 - How do you calculate Relative Unrealized Profit/Loss & SOPR? Examples? How are they different from MVRV Ratio
Relative Unrealized Profit/Loss
The unrealized profit/loss is an on-chain metrics that is the difference between the realized cap and market cap to determine the profit or loss of an UTXO, taking into account the current price of the UTXO if the UTXO has been moved. Simply put, the unrealized profit/loss basically means paper profit or loss that an UTXO incurs before the UTXO has been moved.
For instance, an investor who owns UTXO coins might be in profit or loss because of price increase or decrease. However, that profit or loss is not actualized yet if the UTXO coins has not been spent.
Unrealized profit = If the unrealized profit/loss value is positive
Unrealized loss = If the unrealized profit/loss value is negative
The Relative Unrealized Profit/Loss is simply the value of the Unrealized Profit/Loss divided by the market cap.
Unrealized P/L= Market cap – Realized cap
RUPL = (Market cap – Realized cap) / Market cap
Let’s take for instance;
Market cap of BTC = $900 Billion
Realized cap of BTC = $377 Billion
Unrealized Profit/Loss = $900,000,000,000 - $377,000,000,000
Unrealized Profit/Loss = $523,000,000,000
From the value of the Unrealized Profit/Loss, we can see that it is positive which means that there is an Unrealized Profit of $523,000,000,000.
Relative Unrealized Profit/Loss = ($900,000,000,000 - $377,000,000,000) / $900,000,000,000
Relative Unrealized Profit/Loss = 0.58
From the value of the Relative Unrealized Profit/Loss we can see that the cycle is bullish. This indicates that the market is in the greed stage.
Spent Output Price Ratio
The Spent Output Price Ratio (SOPR) is an on-chain metrics that is the ratio of the UTXO spent value to the UTXO created value. The Spent Output Price Ratio basically evaluates the profit ratio of UTXO. Spent Output Price Ratio indicates the tops and bottoms within a bullish cycle or bearish cycle. Spent Output Price Ratio is calculated by dividing the value of UTXO spent by value of UTXO created. In order words, Spent Output Price Ratio is price of UTXO coin spent divided by the price of UTXO coin created. A value greater than 1 indicates profit and a value less than 1 indicated loss.
Spent Output Price Ratio = Value of coins spent / Value of coins at creation
Let’s take for instance, the UTXO of BTC is 200 with a created price of $15,000, and the spent price of $48,000.
UTXO = 20 BTC
Price at creation = $15,000
Price at spent = $48,000
Value at creation = 20 x $15,000
= $300,000
Value at spent = 20 x $48,000
= $960,000
Spent Output Price Ratio = $960,000 / $300,000
Spent Output Price Ratio = 3.2
From the SOPR value, we can see that the value is greater than 1 which indicates profit.
How are they different from MVRV Ratio
Relative unrealized profit/loss is an On-chain metric that shows the ratio of unrealized profit/loss value to the market cap value. Simply put, it is the unrealized profit/loss value divided by the market cap. When the value of the RUPL is above 0.75, it is can be an indication of a cycle top.
The Spent Output Price Ratio is an On-chain metric that indicates if the UTXO holder is in profit or loss after the UTXO has been spent. When the value of the SOPR is greater than 1, it is an indication of profit, and when the SOPR value is less than 1, it is an indication of loss.
MVRV Ratio on the other hand is an On-chain metric that shows the ratio of the market cap to the realized cap. It is basically the market cap divided by the realized cap. This on-chain metrics indicates if the particular coin is overvalued or undervalued. When the MVRV has a very high value, it is an indication that the coin is overvalued, and when MVRV has a very low value, it is an indication that the coin is undervalued.
Question 2 - Consider the on-chain metrics-- Relative Unrealized Profit/Loss & SOPR, from any reliable source (Santiment, Glassnode, LookintoBitcoin, Coinmetrics, etc), and create a fundamental analysis model for any UTXO based crypto, e.g. BTC, LTC [create a model to identify the cycle top & bottom and/or local top & bottom] and determine the price trend/predict the market (or correlate the data with the price trend)w.r.t. the on-chain metrics? Examples/Analysis/Screenshot?
Fundamental Analysis Model for BTC
For this fundamental analysis, I will be making use of the On-chain Metrics on https://studio.glassnode.com
Relative Unrealized Profit/Loss
From my earlier explanation of the Relative Unrealized Profit/Loss, it is an On-chain metric that shows the ratio of unrealized profit/loss value to the market cap value. Simply put, it is the unrealized profit/loss value divided by the market cap. When the value of the RUPL is above 0.75, it is can be an indication of a cycle top which can also signal for a potential market reversal.
Long term analysis (8 years)
For Cycle Tops

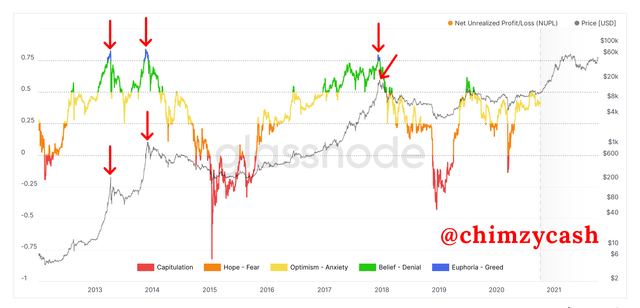
Looking at the BTC analysis in the past 8 years, we can see the different Relative Unrealized Profit/Loss values and the cycle it indicates. The cycles are indicated by their colours on the chart. Blue represents the cycle tops which is the euphoria phase. From the RUPL BTC chart, the RUPL value was 0.80 on April 03, 2013, at this point, the price of BTC was $132 and the market cycle was in the euphoria phase. Investors who bought BTC much earlier and have made lots of profits might begin to sell to take profits. As the selling pressure continues to increase, the price began to drop. We can see on the chart that after the market hit the cycle top, the price of BTC fell to $77 on July 03, 2013 with the RUPL value decreasing to 0.35. At this point, the market cycle was in the optimism/anxiety phase.
However, Buyers began to increase the buying pressure which suppressed the selling pressure, the buying pressure caused the price of BTC rise and enter into an uptrend, creating higher highs and higher lows. This uptrend movement saw the price of BTC hit another cycle top on Nov 27, 2013. The market cycle was in the euphoria phase. The RUPL value was 0.808 on Nov 27, 2013, at this point, the price of BTC was $964. After the market hit the cycle top, reversal occurred. Investors and traders began to take profit. This reversal saw the price of BTC fall all the way down to $223 on Jan 01, 2015, with the RUPL value dropping to -0.287.
After that, the price began to consolidate as the price began to move sideways for a while. The market entered into the accumulation. Large investors began to strategically acquire more and more BTC, the price began to move in the upward direction. As more buyers entered the market and as the buying pressure continued to increase, the market entered an uptrend that saw the price of BTC hit another cycle top on Dec 17, 2017. At this point, the RUPL value was 0.77 and the price was $19,179. After the market hit the cycle top, reversal occurred. Investors and traders began to sell and take profit. This reversal saw the price of BTC fall all the way down to $3,472, with the RUPL value dropping to -0.28. At this point, the market cycle was in the Capitulation phase.
For Cycle Bottoms

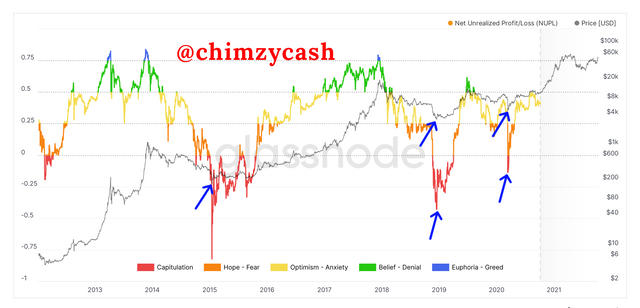
From the RUPL BTC chart, we can see that the price of BTC fell to a cycle bottom. The RUPL value was at -0.493 on Jan 16, 2015 and at this point, the price of BTC was $207 and the market cycle was in the capitulation phase. After that, the price began to move sideways for a while before reversing into an uptrend and hitting a peak price of $19,179.67.
On Dec 14, 2018, the market fell to another cycle bottom. The RUPL value was at -0.43 and at this point, the price of BTC was $3,242 and the market cycle was in the capitulation phase. The marker began to recover and move upwards and entering into the belief phase. The price of BTC was at $11,784. The marker reversed downwards and fell to another cycle bottom. The RUPL value was at -0.13 and at this point, the price of BTC was $5,237 and the market cycle was in the capitulation phase.
Observation/Prediction
Looking at the chart, we can clearly see that there is a strong relationship between the RUPL values and the price of BTC. During the period where the price of BTC was rising and creating higher highs and higher lows, the RUPL value was also seen increasing. At the point where the price of BTC hit its cycle top and reversed downwards, the RUPL value also reflected the cycle top with values above 0.75 and was in the euphoria phase. At this phase, distribution might occur as investors who are on profit begin to sell to take pressure. The selling pressure begins to push the price down. However, there is no guarantee that the downtrend move would occur as the price can continue rising even after hit a cycle top.
Also, during the period where the price of BTC was falling and creating lower highs and lower lows, the RUPL value was also seen decreasing. At the point where the price of BTC hit its cycle bottom, the RUPL value also reflected the cycle bottom with values below 0 which was the capitulation phase. At this phase, accumulation might occur as large investors and other smart investors begin to strategically acquire more coins. As the buying pressure continues to increase and suppress the selling pressure, the price began to rise. After that, the price of BTC reversed into an uptrend which saw the RUPL value increase from the capitulation phase to the euphoria phase.
.png)
Based on the chart, the current price of BTC is $53,892 and the Relative Unrealized Profit/Loss RUPL value is at 49% or 0.49. This means that the market cycle is currently in the optimism phase. Investors and buyers are optimistic that the price of BTC could hit another cycle top by reaching its previous all-time high or surpassing it. If the price manages to break above its previous resistance level of $59,500 and the RUPL value moves into the greed zone, there is a strong possibility that the price of BTC could surpass its previous all-time high.
Spent Output Price Ratio
From my earlier explanation of the Spent Output Price Ratio, it is an on-chain metrics that is the ratio of the UTXO spent value to the UTXO created value. The SOPR basically evaluates the profit ratio of UTXO. Spent Output Price Ratio indicates the tops and bottoms within a bullish cycle or bearish cycle. Spent Output Price Ratio is calculated by dividing the value of UTXO spent by value of UTXO created. A value greater than 1 indicates profit and a value less than 1 indicated loss.
Long term analysis (3 years)
.png)
Looking at the SOPR analysis in the past 3 years, we can see the different local tops and local bottoms it indicates. On Jun 26, 2019, the SOPR value was 1.06 and at that point, the price of BTC was $13,003. Like I explained already, when the value of SOPR is above 1, it is means that traders are selling at a profit which could potentially see the marker reverse. We can see that the price began to fall from that point. On Mar 12, 2020, the SOPR value was 0.92 and at that point, the price of BTC was $4,860. This means that during that period, investors or traders sold at a loss. After that, buyers stepped in and drove the price to $9,982, the SOPR value was 1.04 which formed local top on May 7, 2020.
During the bull market, when the SOPR value is below 1, it is rejected and the market continues to make higher highs and higher lows. When the SOPR value is below 1 in a bull market, it means that there are investors who will sell at a loss in a bull market due to fear or other factors. However, as buying pressure continue to increase and suppress the selling pressure, the market continues to rise and create new highs.
Also, in a bear market, when the SOPR value is above 1, it is rejected as the market continues to make lower highs and lower lows. When the SOPR value is above 1 in a bear market, it means that there are investors who are selling or holding to sell when the hit their break-even price point. As selling pressure continue to increase and suppress the buying pressure, the market continues to fall and create new lows.
Observation
Looking at the chart, we can clearly see that there is also a strong relationship between the SOPR values and the price. A local top was formed when there was a significant increase in the SOPR value above 1. This means that a lot of investors are selling at a profit and this was followed by a fall in price. Also, a local bottom was formed when there was a significant decrease in the SOPR value below 1. This means that a lot of investors are selling at a loss and could be a good signal for buy entry.
Question 3 - Write down the specific use of Relative Unrealized Profit/Loss (RUPL), SOPR, and MVRV in the context of identifying top & bottom?
Relative Unrealized Profit/Loss (RUPL)
Relative Unrealized Profit/Loss has proven to be a really effective on-chain metrics for indicating cycle tops and cycle bottoms. The RUPL value is derived from dividing the Unrealized Profit/Loss by the market cap. RUPL value above 0.75 is a strong indication of a cycle top and RUPL value below 0 is a strong indication of a cycle bottom.
Because of the strong relationship between RUPL and price, it becomes very powerful indicator for determining good buy and sell signals. Investors can make use of the RUPL to determine the various stages in the market cycle so as to make the best decision. When the RUPL value is below 0, it means that the market might be in the accumulation phase, which is a good buy signal to anticipate a possible reversal to an upward direction. Also, when the RUPL value is above 0.75, it means that the market might be in the distribution phase, which can be a good sell signal to anticipate a possible reversal to a downward direction.
Spent Output Price Ratio (SOPR)
Spent Output Price Ratio has proven to be really effective on-chain metrics for indicating local tops and local bottoms. The SOPR value is derived from dividing the value of coins spent by the value of coins at creation. SOPR value that is significantly above 1 is a strong indication of a local top and SOPR value that is significantly below 1 is a strong indication of a local bottom.
This becomes very powerful indicator for determining when investors are selling at a profit or selling at a loss. Because of the strong relationship between SOPR and price, it is also a powerful indicator for determining good buy and sell signals. Investors can make use of the SOPR to determine when a bull run is coming.
MVRV
MVRV has proven to be really effective on-chain metrics for indicating when a cryptocurrency is overvalued or undervalued. The MVRV value is derived from the result of the market cap divided by the realized cap. When the MVRV is above 200% it is a strong indication that the coin is overvalued and for identifying tops, and when MVRV is below 100%, it is a strong indication that the coin is undervalued and for identifying bottoms.
Investors can make use of this indicator for good buy and sell signals. When an asset is overvalued, it can be a good signal for a possible reversal into the downward direction, and when an asset is undervalued, it can be a good signal for a possible reversal to an upward direction.
Conclusion
When it comes to investing and trading in any UTXO cryptocurrency, on-chain metrics is without a doubt a very valuable tool in terms of price prediction. The Relative Unrealized Profit/Loss and Spent Output Price Ratio have proven to be really good on-chain metrics for identifying tops and bottoms in the market. Investors can make use of these on-chain metrics as good signals for buy and sell. When the RUPL and SOPR are utilized correctly, they can provide useful signals in the market in order to make the best trading decision.