Homework: Trading Crypto With Ichimoku-kinko-hyo Indicator - Part 2
Professor @kouba01
Written by @chinma
Picture from source

1. Discuss your understanding of Kumo, as well as its two lines. (Screenshot required)
Before discussing about about kumo, let us review briefly about the importance of the Ichimomu Indicator. Ichimoku Indicator is a very important indicator for profitable crypto trader, this indicator has stayed for a long time (about 2 decades) and it is still a reliable indicator.
Originating from the Japanese part of the world, the Ichimoku indicator sometimes looks complex but if properly studied and understood, it can very profitable for the trader.
The Ichimoku is made up of the Chikou span, Tenkan-sen, Kijun-sen, senkou span A and Senkou Span B. Always remember that the ichimoku indicator is used to determine the future areas of the support and resistance and also gauges the future price movement.
But today, we are discussing about just one part of the ichimoku Kinko Hyo, which is the Kumo. Kumo which literally means "Cloud" in Japan is fondly called the kumo Cloud. The Kumo cloud is an essential part of the ichimoku, it constist of the two parts, which are the Senkou Span A(SSA) And the Senkou Span B (SSB). Without these lines , Kumo cloud cannot formed. so lets discuss about the functions of these lines. Senkou Span B normally works with Senkou Span A, these are two separate usually parallel lines but not straight, the opposite distance between the lines provides a space and that space is what is called the Kumo Cloud.
The Kumo is like the forerunner of the price, giving traders pre-insights about price trend, before price actually conforms to its signal.
Senkou Span A:
The Senkou Span A which is also known as leading Span A, it is used to know the momentum of price, the Senkou Span A line is the average of the Tenken Span line and Kijun Span line, as we remember these lines are median/equilibrium lines (not moving averages) so the Senkou span A line inherits these characteristics from these its parents lines.
The Senkou Span A line can be calculated with the formular:
Senkou Span A = (Tenken-Sen + Kijun-sen)/2Then projected 26 periods forward.
It acts as a resistance and support line to the chart and can be shown in the chart below:
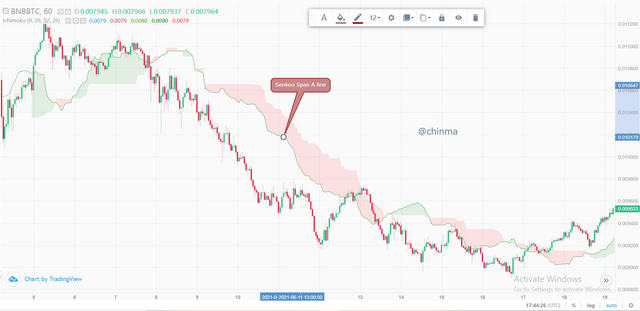
BNB/BTC Chart form Binance
Senkou Span B line:
The Senkou Span B is also called leading span B, the Senkou Span B line is the second of the two lines, forming the Kumo cloud. It can be calculated as the median of the 52 period on the chart.
The Senkou Span B line like the Span A line also acts as a resistance and support to the chart.
To calculate the Senkou Span B liine:
- Take the Highest point of the chart over 52 periods. (HH52)
- Take the Lowest part of the chart over 52 periods. (LL52)
- Sum them together and divide by 2.
- Project 26 periods into the future.
- Repeat realtime calculation of the previous processes with chart.
Below is the Senkou Span B line on the chart.
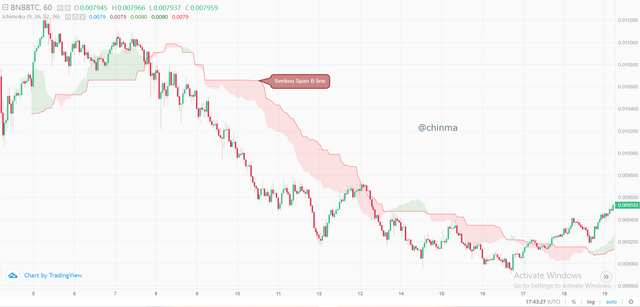
BNB/BTC Chart form Binance
The Kumo Cloud
With a full exploration of the Span A and B lines, we see that the Kumo cloud is a good support and resistance cloud.
More on the Kumo cloud, it is a good trend detection indicator, this which we shall be discussing in detail in question number 2 it is also a good Dynamic Support and Resistance Indicator(more on number 2).
Below is shown the Kumo Cloud on the chart.
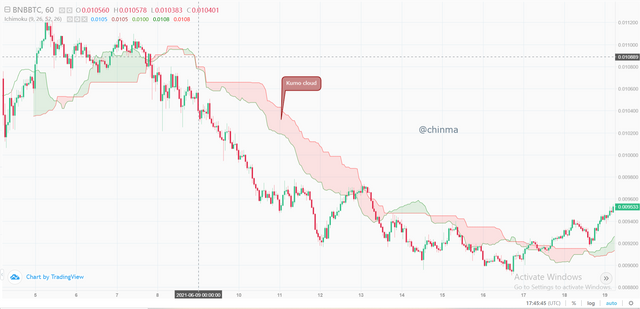
BNB/BTC Chart form Binance
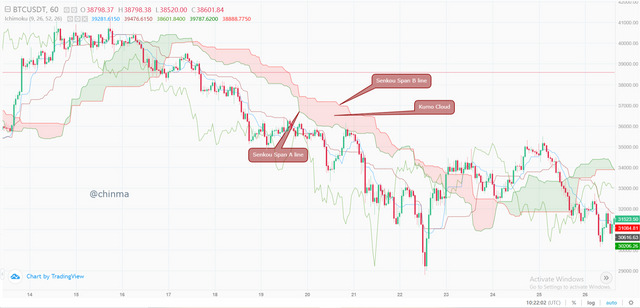
BTC/USDT Chart from Binance
Here we can see that the cloud gives a downward formation, as price also trends downwards. This is a good indication of the current state of price by the Kumo cloud.
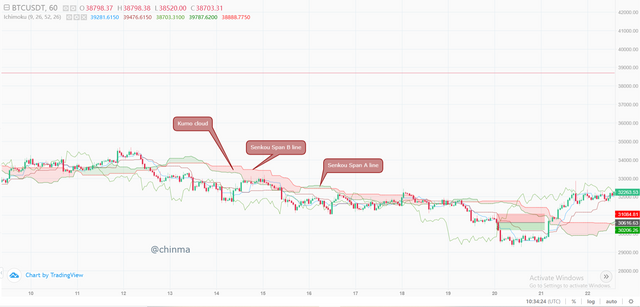
BTC/USDT Chart from Binance
Here we can see the Kumo looks flat, giving a ranging picture. This is also the state of price, ranging finding either a bullish or bearish breakout.
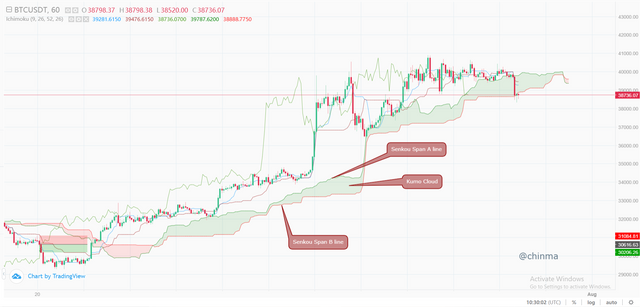
BTC/USDT Chart from Binance
Here we can see the Kumo cloud tends upward, and price following suit. This is a good indication of the current state of price by the Kumo cloud.

2. What is the relationship between this cloud and the price movement?
The Kumo cloud plays a very good role in determining Price movement, the relationships between the kumo cloud and the price movement can be stated as follows:
- Determine price trend
- Determine price trend change
- Determine no price trend
- Determine price trend weakness
Determine price trend:
The major characteristic of the kumo cloud is to Determine the current trend in one look
When the kumo cloud has a positive gradient with the Senkou Span A line ontop the kumo cloud making it have a general positive gradient and colour green, it shows that the price is in a bullish trend.
So also when the Senkou Span A is below the cloud, and the cloud having a general negative gradient, and colour red. Price is in a bearish trend.
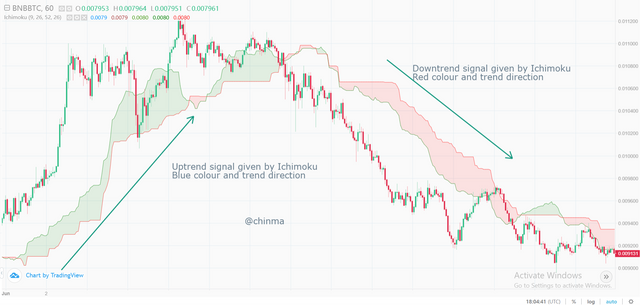
BNB/BTC chart from Binance
With the help of the kumo cloud the direction of the price trend can be known. If the kumo cloud is red, it is an indication that the price trend is getting bearish but if the kumo cloud is blue, it is indication that the price trend is getting bullish.
Trend Change:
The Kumo cloud gives one of the first signals of trend change. With the Twist when the Senkou Span A line crosses the Senkou Span B line, it signifies an end of the current trend. Picture below.
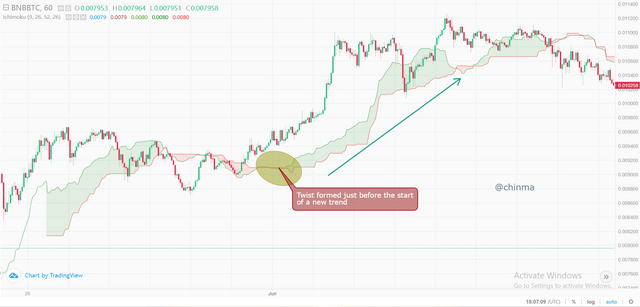
BNB/BTC chart from Binance
The twist comes with a change in colour of the kumo cloud which is a sign of an intending change in current trend.
No Trend:
The Kumo cloud also being an equilibrium cloud tells us of when the kumo has a rather zero gradient (horizontal cloud) giving the indication of a consolidating market.
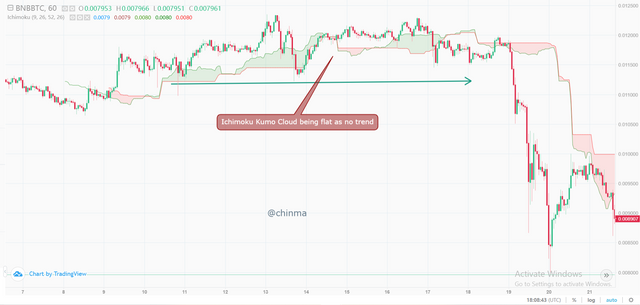
BNB/BTC chart from Binance
The direction of the cloud also is used to determine the direction of the price, with upward moving cloud the price sees an uptrend, vice versa for a downward moving cloud and the price. This which is used in determining Trend Confirmation.
Trend Weakness/Kumo Widening:
When the Kumo widens up, it creates a signal of trend volatility, this which shows that the current trend is more likely to change direction and traders should be weary of entering the market at such trends.
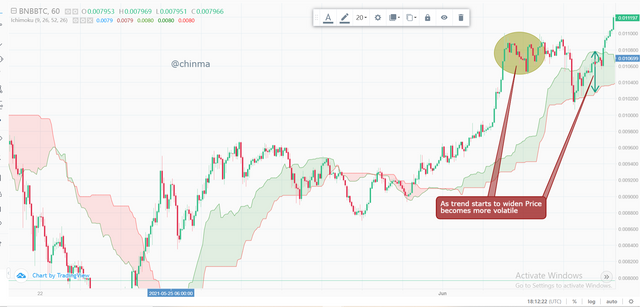
BNB/BTC chart from Binance
With the thickness of the cloud you can determine how strong a trend is, the thinner the cloud, the more price moves in respect to the direction. the thicker the cloud, the weaker the trend and price the price movement due to more volatility.

2.b How do you determine resistance and support levels using Kumo? (Screenshot required)
Treating Dynamic Support and Resistance last week, we see the Kumo cloud can be a good Dynamic support and resistance indicator to price.
The resistance / support can be determined by locating a point in the kumo cloud that price tries to pierce through. These which are actually the Senkou span A and Span B lines,
The support and resistance points help us anticipate buy and sell positions, if you want to place a sell trade, you may want to do so after price has hit a dynamic resistance, so also if you want to place a buy trade, doing so after price has hit a dynamic support and is retracing back to trend.
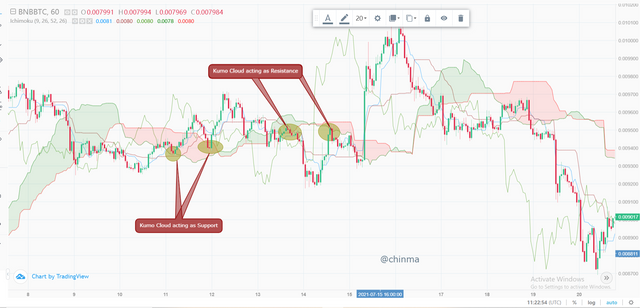
BNB/USDT chart from Binance
From the above chart, we see that with price hitting edges of the Kumo cloud, it retraces back either upward or downward depending. This which is an attribute of support and resistance given by the cloud.

3. How and why is the twist formed? And once we've "seen" the twist, how do we use it in our trading? (Screenshot required)
The twist which is formed when the Senkou Span A crosses the Senkou Span B either ways is caused by a weakness of trend.
As trend weakens, the Ichimoku Cloud soon signaling traders of an end of the trend mostly with the closing in of the Senkou Span A to the Senkou Span B.
On their crossing, the Twist is formed and traders start watching for a ranging market.
To use the Twist in Trading, since after the twist is usually a ranging market, traders buy at the range low, and sell at the range high level. This which is a risky trade since ranging markets can be unpredictable due to breakouts.
A bullish kumo twist usually happens when the senkou span A crosses the Senkou span B from below and the bearish kumo twist occurs when the senkou span B crosses the senkou span B from above.
Once the twist is completed, you have to wait for other indications to be completely formed such as price breaking any resistance and support of the Kumo cloud, and the Chikou and Senkou span B lines being in alignment with price trend before executing any trade.
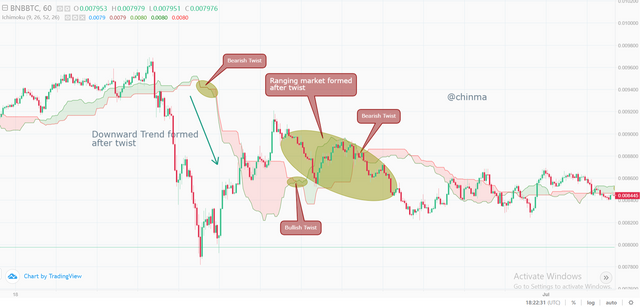
BNB/USDT Chart from Binance

4. What is the Ichimoku trend confirmation strategy with the cloud (Kumo)? And what are the signals that detect a trend reversal? (Screenshot required)
The Ichimoku trend confirmation strategy is a trading process using the Ichimoku where one waits for the designated signals which usually occur in order. One can now be sure price is in trend and is able to place trades within the trend.
The signals that detect a trend reversal are:
The Twist:
When the two Senkou span lines (A and B) interchanges it is a good signal that price may be coming to an end of its current trend and some consolidation leading to a new trend (most likely a reverse trend).
Price Breaking through the Kumo Cloud.
With the occurrence of the twist, traders become skeptical of the current trend and await a new trend signal. Now they wait for price to break through the cloud in whatever direction the new trend will be. This is a good Trend Birth detector and on occurrence, traders start looking for good entry points into this new trend.
Chikou Span line Breaking through Cloud:
Next is the Chikou span line breaking through the cloud. This is a good confirmation of previous trend ending and a new trend entry. It gives traders the cue to place entry positions on price.
Senkou Span B line moving with Trend:
The Senkou span B line is the slowest moving line of all the Ichimoku lines, when this line synchronizes in the same direction as price trend, a new trend is fully formed. Traders can now comfortably join the trend watching for its future weakness for exit.
Therefore for the Ichimoku trend confirmation strategy with the cloud the following Strategy should be followed:
- The Senkou Span A line should have crossed the Senkou Span B line "(The Twist)"
- The chikou Span line and price should have broken the nearest Kumo cloud support or resistance.
- The cloud should be in the expected direction as the new trend.
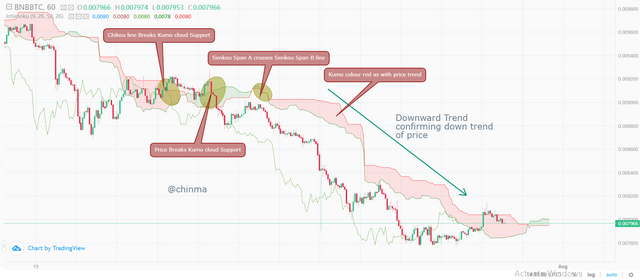
BNB/USDT chart from Binance
From the above chart, we see that the Kumo has a downward direction with the Senkou span B line having a downward momentum, the twist has already been formed above, and the Chikou and Price have broken the Kumo Support zones.
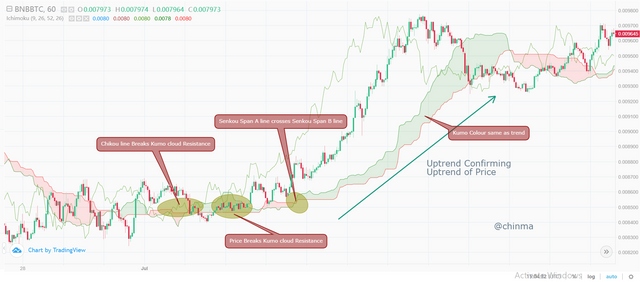
BNB/USDT chart from Binance
From the above chart, we see that the Kumo has an upward direction with the Senkou span B line having an upward momentum, the twist has already been formed below, and the Chikou and Price have broken the Kumo Resistance zones.
Trend signal detection with the Ichimoku Kumo is pretty easy:
It always starts with a Twist, this which indicates previous trend weakness, then we look for counter trend movement from the Tenken and Kijun lines, The Tenken and Kijun lines are the fastest lines of the Ichimoku Uno, so counter movement from them indicates a trend reversal already.
Next we observe the Chikou, and the Senkou Span B lines, on full reversal of these lines, definitely the trend has reversed and a new trend is birthed.
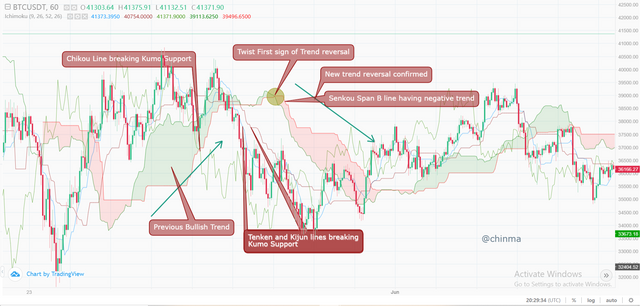
BTC/USDT chart from Binance

5. Explain the trading strategy using the cloud and the chikou span together. (Screenshot required)
The Kumo cloud and Chikou span which are great Resistance and support indicators to price, also act together to give a trend entry confirmation.
For this exercise we shall be very practical, following the recent pump in the BTC, we shall be explaining using the Ichimoku Cloud and the Chikou Span line.
First we watch the Kumo span, if there has been any recent Twist. The Kumo twist tells us of ending trend of the market.
(Take note the Kumo is 26 periods in front of the cloud, so we view the chart 26 periods behind the Kumo in this exercise)
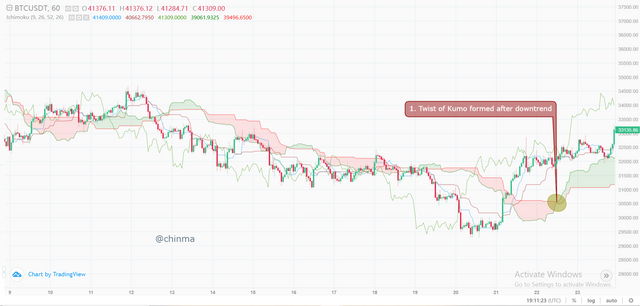
BTC/USDT chart from Binance
From the above chart we see that the Kumo just had a twist, one implying the end of a downtrend.
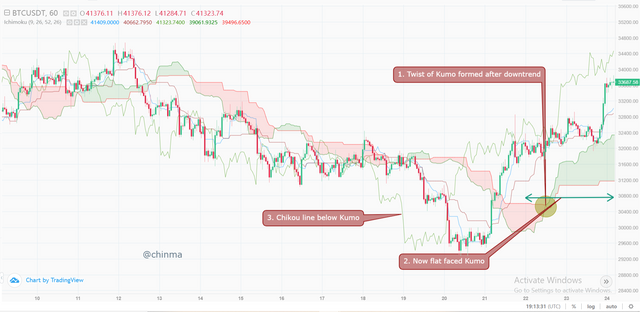
BTC/USDT chart from Binance
Next, we look at the gradient of the kumo this is to know if the market has any trend at all or is ranging.
The Kumo is currently having a zero gradient. We have to wait for a trend or trend signal.
Looking at the Chikou line, it is still below the Kumo line it’s a current mini downtrend from the market, we should be skeptical of it.
Moving forward, (some hours later)
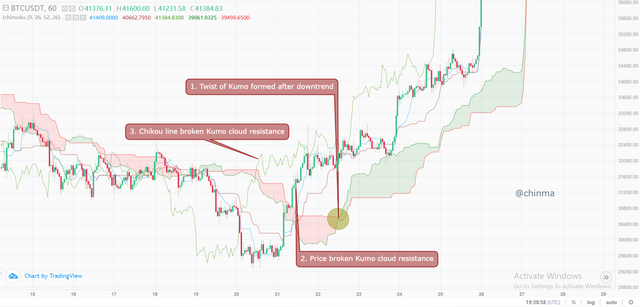
BTC/USDT chart from Binance
Price has made a bullish run, breaking the Kumo cloud, so also with the Chikou line.
The kumo is widening, price is getting volatile, maybe a bullish breakout is imminent.
Moving forward,
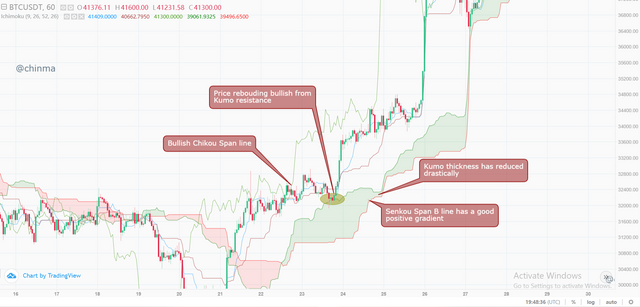
BTC/USDT chart from Binance
The Kumo has started getting slimmer again, price momentum is building, The Senkou Span B line is having a good gradient, the Tenken, Kijun and Chikou lines are still Bullish, we set for our Long position.
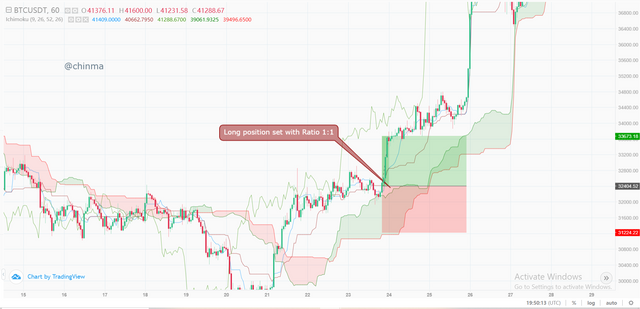
BTC/USDT chart from Binance
We enter our long position with a Risk to Reward ratio or 1:1.

6. Explain the use of the Ichimoku indicator for the scalping trading strategy. (Screenshot required)
The Ichimoku Indicator as a “one look” indicator makes it easy for scalp traders to quickly tell what is going on in the market.
At first look, the Kumo cloud (Senkou Span A and B lines) gives us an instant visual view of the current sentiment of the market(either bullish or heading bullish, or bearish or heading bearish). It also gives a “Support and Resistance” zone to price and lastly tells us of market trend weakness and volatility also giving us a trend confirmation or trend reversal.
Next we see the Tenken and Kijun lines. These lines which tell us of equilibrium positions of price, making us understand in one view if price is in an uptrend, downtrend or no trend.
Lastly the Chikou line, the Chikou line again is a reconfirmation of resistance and support line, telling us of possible market entry and re-entry and exit areas.
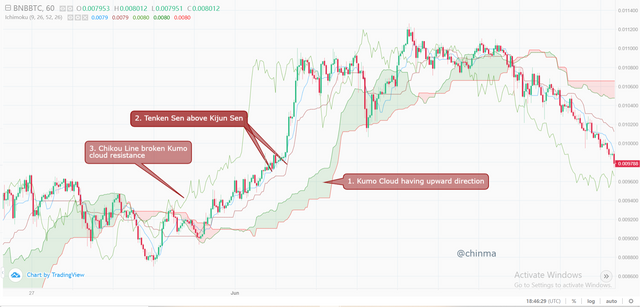
BNB/USDT chart from Binance
If it is a buy order firstly, the Chikou span must be above the cloud(Kumo). The Senkou span A must have crossed the Senkou span B upwards, the direction of the cloud should be uptrend.
The Tenken Sen must also be above the kijun sen and finally the colour of the cloud should have changed, indicating a buy trend, which is depending on your setting.
Before executing the buy order, you should watch the market structure, if the price is heading towards a major support line, you can execute the buy order after price hits support. then properly set your take profit based on the risk to reward ratio which 1:1 is advisable . also set your set loss, in case the trade goes against you.
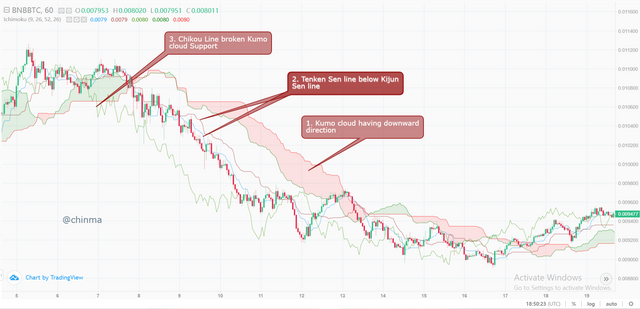
BNB/USDT chart from Binance
For a sell order, the Chikou span must be below the Kumo cloud, also the kijun sen should be above the Teken sen. The Leading span B Must be above Leading span A and the cloud should be facing downward couple with the color change should be observed too.
If the price is tending towards a resistance in the market structure U set your Sell order after it hits and is making a U turn. With all these conditions met, you can now execute a sell order setting your Take profit and Stop loss with a risk to reward ratio of 1:1.

In conclusion, I would like to point out some tips the Ichimoku Uno indicator has taught us,:
- Support and Resistance are actually zones and not just lines
- Price trend weakness doensn’t necessarily mean price wont continue in trend
- Ichimoku thickness is a good indicator for price volatility
- Ichimoku cloud (Kumo) is still and equilibrium indicator.
The Ichimoku Uno has proven to being a wonderful indicator, teaching us more about technical market analysis.
Thanks to professor @kouba01 for this wonderful lecture
CC@kouba01
Hello @chinma,
Thank you for participating in the 5th Week Crypto Course in its third season and for your efforts to complete the suggested tasks, you deserve a 7.5/10 rating, according to the following scale:
My review :
Good work in general, in which you covered most of the aspects required to understand the Kumo and its uses, and I have some notes:
Your interpretation of the cloud for the Ichimoku indicator and its components was good and clear in all its aspects.
As for the relationship of this cloud to the price movement, it can be determined according to the thickness of the cloud, where the higher the density of the cloud, this indicates the high volatility of the market in that period. The increased price movement and its volatility will lead to the divergence of the two lines, which gives us the impression of stronger fluctuation in the price movement.
As for determining the levels of support and resistance based on the Ichimoku cloud, it differs from the traditional method, and this is what you are asked to interpret.
Your interpretation of the twist and how to use it when trading is missing some depth in the analysis.
The Question What is the Ichimoku trend confirmation strategy with the cloud (Kumo)? It is not well explained, while the second part is better interpreted.
Thanks again for your effort, and we look forward to reading your next work.
Sincerely,@kouba01
Downvoting a post can decrease pending rewards and make it less visible. Common reasons:
Submit