Discuss as per your understanding on Reverse Strategy with some graph examples. (Title For this topic will be Technical Details On Reverse Strategy)
Technical Details on Reverse Strategy
Reversal strategy is a strategy used in the technical analysis of cryptocurrency to find the exact moment in which a trend will be reversed. If a coin has been bullish for quite some time, it is the duty of the reverse trader to predict when there will be a reversal and hope on it. It shows the day’s high or low and one of the mistakes that can be made in predicting the timing of a reversal wrongly.
How does the reverse strategy work?
To forecast the exact reversal time, traders must understand the support and resistance levels. If a coin is trading near a support level, it will likely boom from the support level and the same applies to the resistance level.
Trend reversal can be identified using two ways;
Identify support on the higher timeframe which could be daily; it is better with a more significant level
Identify an accumulation stage on the lower timeframe which could be one hour.
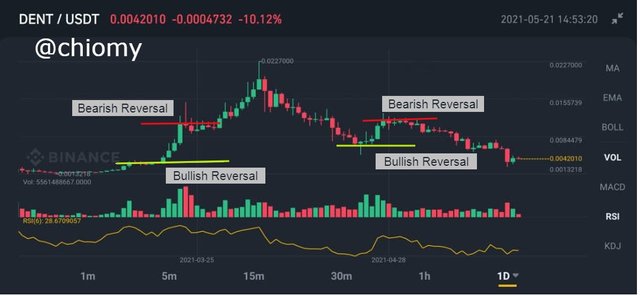
Showing Reverse Strategy on DENT/USDT Pair
I explored the DENT/USDT pair on my TradingView chart pattern to identify the reversal noting the bullish and bearish reversals. See screenshot below.
Discussed the COINGECKO and explore it well. (Title for this topic will be Review Of COINGECKO and below points need to explain).
What Is A COINGECKO?
Coingecko is a data platform founded in April 2014 by Bobby Ong and TM Lee with the aim of giving digital currency price, information, and fundamental analysis of the cryptocurrency market. There is a lot more information that coingecko gives which includes; market capitalization, trading volume, and other analyses. Cryptocurrencies traders can avail themselves the opportunity of gaining access to this information on coingecko.com.
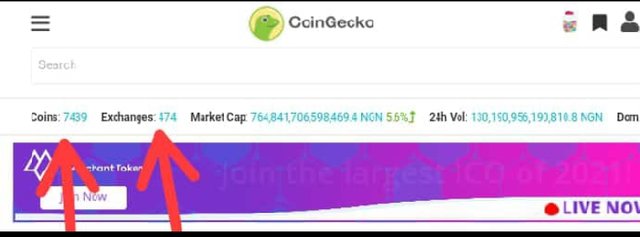
As of the time of writing this, there are 7439 coins and 474 exchanges on coingecko.
How COINGECKO Can Be Helpful for you in a Crypto Market?
Coingecko is quite helpful in several ways and some of the points would be listed below
It gives reliable information about crypto assets such as price fluctuations over periods of an hour or more which investors can leverage on.
It displays contract addresses for cryptocurrencies and ensures that the right contract address is being used. This is useful when buying ERC-20 tokens from decentralized exchanges.
It shows the trading volume of cryptocurrencies in the market and historical charts are shown which helps traders to see the trend of the market.
The information given influences a trader’s decision on which asset should be purchased and which one has a good future to increase in price.
Explore COINGECKO features with information.
Top cryptocurrency categories by market capitalization
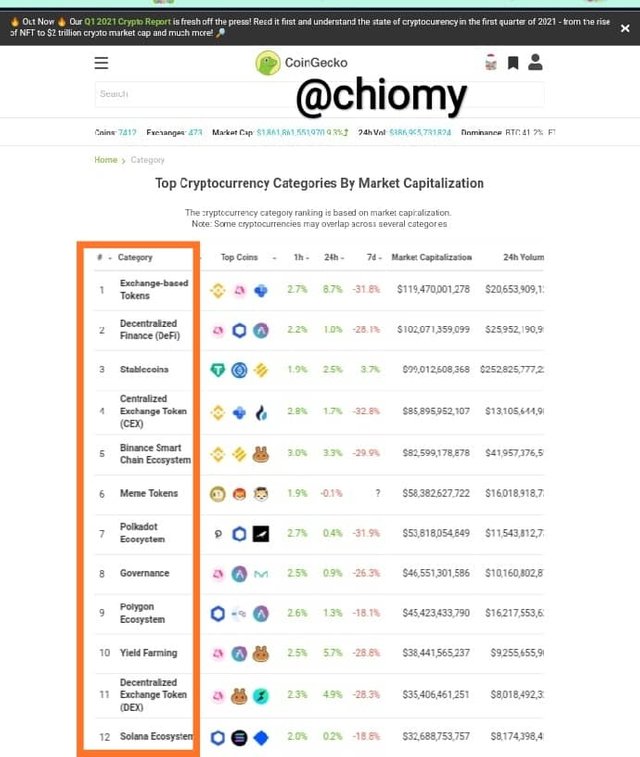
This is the first information that is shown on the landing page of CoinGecko. The cryptocurrency category is based on market capitalization. Some of the categories are exchange-based token, decentralized finance, stablecoins, centralized exchange token, and many more.
It also shows information such as the top coins, market capitalization, and trading volume within 24hours. From my screenshot, Exchange-based tokens top the list with a market capitalization of $119,470,001,278.
Cryptocurrency price by Market Cap
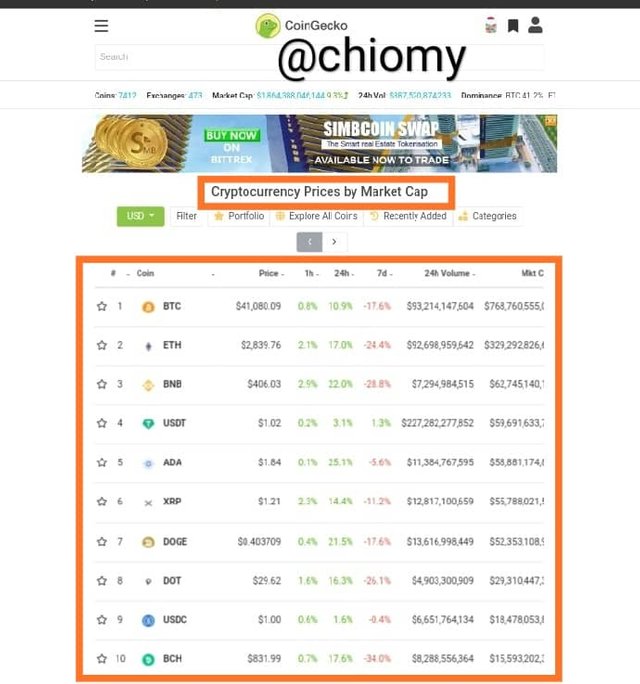
This feature shows the prices of cryptocurrencies by market capitalization. It shows the price, percentage change in price, trading volume, and market capitalization. From my screenshot, BTC tops the list.
Recently Added Coins
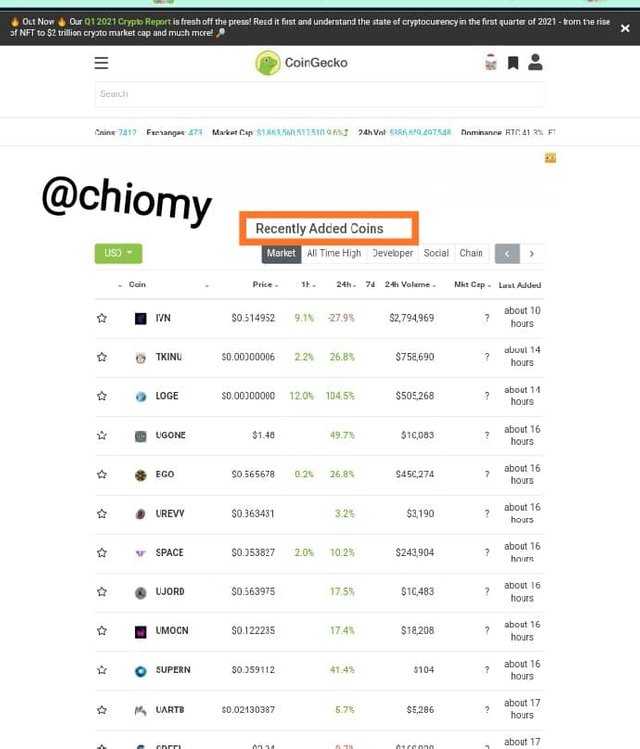
This feature shows a list of recently added coins from the latest. From my screenshot, it is shown that the most recent coin (IVN) was added about 10hours ago. It also shows other information like the price, trading volume, and market capitalization.
Exchanges
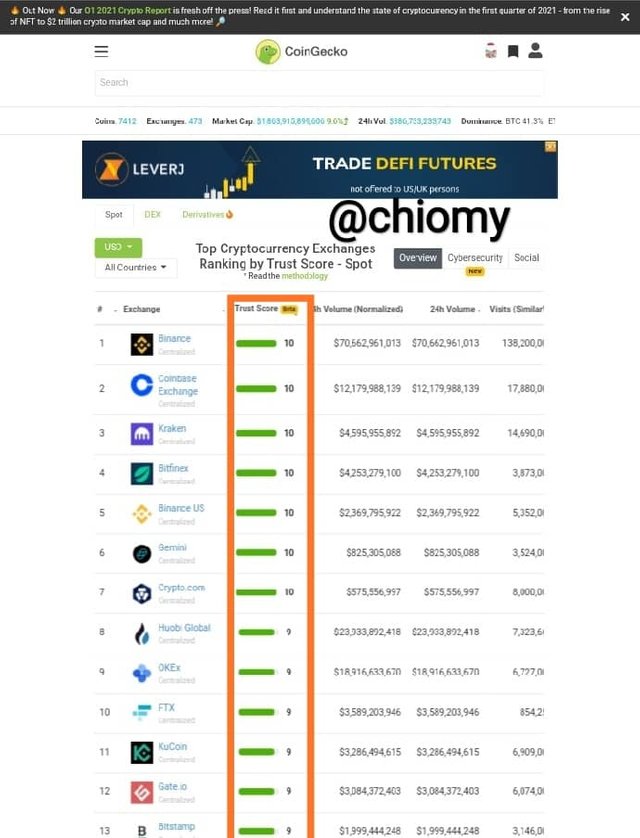
This is another feature of the app. It has options such as spot, DEX, and derivatives. Spot shows offers of spot services while DEX shows decentralized exchanges and those that offer contract trading. For the purpose of this homework, I used spot and Binance exchange tops the list with a trust score of 10, followed by Coinbase exchange.
Preference of currency
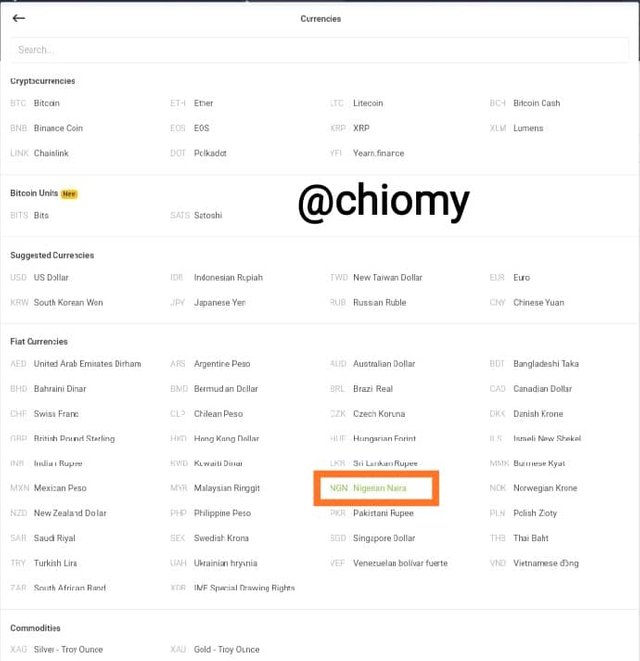
You can decide to choose any currency for the prices to be translated. All you have to do is click on the drop-down and select the one that suits you. For me, I chose the Nigerian Naira because it is my country’s currency.
Weekly Price Forcast For Crypto Coin: XXXXX(Title will be the same just replace XXXXX with the Coin name and covered all below points in it as a part of Price Prediction for the next 1 week.)
Weekly Price Forecast for Crypto “TRX/USDT” Pair
I will be forecasting the price of TRX/USDT and I decided to do this because, over the last few weeks, Tron has really increased in price by over 200%. Sometime in February, it sold for N15 and at the end of April, it has increased to N70 (in Nigerian currency).
What is TRX
TRX is the native token of the Tron network which was founded in 2017 by Justin Sun. The blockchain has brought about free transactions on the blockchain and all tokens are considered to be TRC-20 tokens. As of the time of writing this post, the price of TRX is $0.08974 with a market capitalization of $6,431,047,863.53. It is ranked #23 in the market and has a trading volume of $2,522,440,050.55. All information got from Coinmarketcap.
My TRX interest
I’m interested in TRX because of its improvement in price and the innovations that have been ongoing in the crypto market. Some of the amazing features are;
The tron network is a virtual platform where users can share digital contents for free
It has very good compatibility with smart contracts
The transaction speed is fast and processes up to 2000 transactions in one second
Both transaction fee and charges are low in the Tron blockchain
Technical Analysis- TRX/USDT Pair
I will be using technical analysis to forecast the price of TRX/USDT. I will be observing the supports and resistance which may have caused a trend reversal and this prediction will be for a period of one week.
At the time of writing this, the price is at 0.08975 USDT. TRX/USDT is going through a downtrend which has affected other coins too and support is seen at the low level of 0.08502 USDT which kind of shows that there was really no trend reversal before it reached this level and it opens up a good position for buy where its high will likely be 0.13290 USDT.
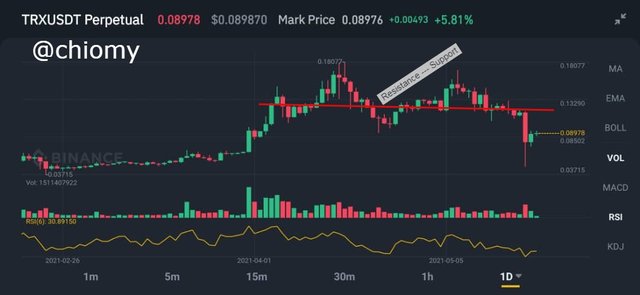
My prediction is that there will likely be a trend reversal in the next week at the support level of 0.08502 USDT and the next high will be set at 0.13290 USDT which may even shoot up to 0.15672 USDT.
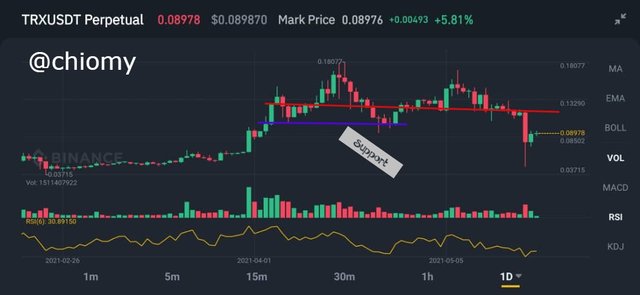
From my study, I have the following data to show the estimates from the chart pattern of the TRX/USDT pair. And the technical analysis was based on the price history of the asset noting the supports, resistances, and reversal trends over time to make a price forecast for the asset in the next week.
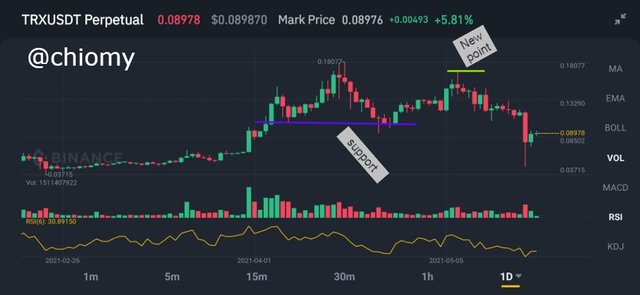
From my analysis of the TRX/USDT pair using technical analysis, I can say that the next low will be 0.08502 USDT and the next high will be 0.13290 USDT and will likely increase to 0.15672 USDT.
Conclusion
The reverse strategy is a very good strategy for trading and can be very useful for profitability if well studied. CoinGecko is a digital app/platform that gives users reliable information about the cryptocurrency market and helps influence their trading and investment decisions.
Cc: @stream4u
Hi @chiomy
Thank you for joining The Steemit Crypto Academy Courses and participated in the Homework Task.
Your Homework Task verification has been done by @Stream4u, hope you have enjoyed and learned something new.
Thank You.
@stream4u
Crypto Professors : Steemit Crypto Academy
#affable
Downvoting a post can decrease pending rewards and make it less visible. Common reasons:
Submit