(1) How do you calculate Relative Unrealized Profit/Loss & SOPR? Examples? How are they different from MVRV Ratio(For MVRV, please refer to this POST)?
(2) Consider the on-chain metrics-- Relative Unrealized Profit/Loss & SOPR, from any reliable source(Santiment, Glassnode, LookintoBitcoin, Coinmetrics, etc), and create a fundamental analysis model for any UTXO based crypto, e.g. BTC, LTC [create a model to identify the cycle top & bottom and/or local top & bottom] and determine the price trend/predict the market (or correlate the data with the price trend)w.r.t. the on-chain metrics? Examples/Analysis/Screenshot?
(3) Write down the specific use of Relative Unrealized Profit/Loss(RUPL), SOPR, and MVRV in the context of identifying top & bottom?
(1) How do you calculate Relative Unrealized Profit/Loss & SOPR? Examples? How are they different from MVRV Ratio(For MVRV, please refer to this POST)?
The unrealized profit and loss simply refer to the hypothetical profit that can be made or hypothetical loss that can be made from an asset on an asset, and it can be calculated with the help of market capital and realized capital. The primary purpose of the RUPL is to calculate potential losses and gains and possibly to identify Cycle tops and bottoms in an asset
But to apply this formula one would have to first of all know what a market cap and a realized cap is.
A market cap is simply defined or can be seen as the total worth of a company and how that is calculated is by multiplying the no of products or share the company own by its value.
Similarly the realized cap is seen to be very similar but the realised cap tends to use the most recent value of the last UTXO (as of when it was last most recently moved)of the asset multiplied by the no of shares or product of that asset.


EXAMPLE
Lets assume Mr A had 100 Steem which had a total supply of 200, he sparsely distributed his 100 steem among 3 UTXOs. 50 steem was moved in the first UTXO at a price of 105USD each 5 weeks ago and 4 weeks ago he moved another 30 steem extra in his second UTXO at a price of 125 USD and a week ago he moved the last 20 at a price of 110USD. Now assuming the current value was still 110 our
Market cap would be
110 X 200 = 22,000 USD
Realized cap would be
50 X 105 = 5,250$
30 X 125 = 3,750$
20 X 110 = 2,200
= 5250 + 3750 + 2200 = 11,200$
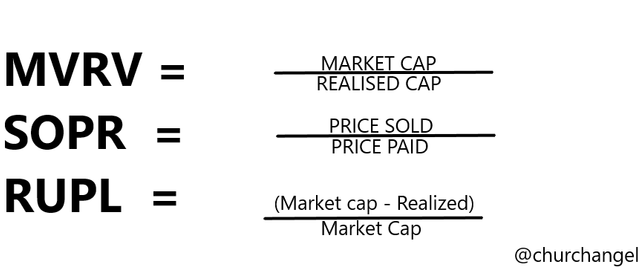
RUPL= MARKET CAP - REALISED CAP/MARKET CAP = 22,000 - 11,200/22,000 = 0.49 OR 49%
Since our RUPL is positive and between 0.25-0.50 we can safely say it is in the Optimism/denial phase
- SOPR
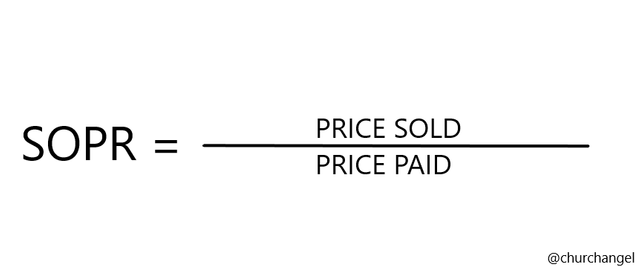
Spent output profit ratio is an onchain metric that identifies or indicate an assets average profits or losses over a particular periods movement. The SOPR is calculated by dividing the value at which the one paid for the coins and the price at which the coins were initially created.

An SOPR with a >1 number indicates that the holder of the assets or trader is in profit while if the returns i.e the SOPR has a value <1 it indicates the holder of the asset or trader is at a loss.
Example
Assume Mr A decided to sell 15 steem at a value of 110$ per steem which he initially bough at a value of 125$ then his SOPR would be
Price sold/Pice paid = 110/125 = 0.88
This simply implies that Mr. A is at a loss
How are RUPL & SOPR different from MVRV Ratio
The major difference in RUPL and SOPR can clearly be seen in the parameter they each require for their calculation/Formular the RUPL requires the subtraction of realized cap from market cap and divided by the market cap while the SOPR requires division of Price sold for an asset by price an asset was paid for while the MVRV ratio is calculated by simply a division of market cap by realized cap. Pictoral detail below


Q.2. Consider the on-chain metrics-- Relative Unrealized Profit/Loss & SOPR, from any reliable source(Santiment, Glassnode, LookintoBitcoin, Coinmetrics, etc), and create a fundamental analysis model for any UTXO based crypto, e.g. BTC, LTC [create a model to identify the cycle top & bottom and/or local top & bottom] and determine the price trend/predict the market (or correlate the data with the price trend)w.r.t. the on-chain metrics? Examples/Analysis/Screenshot?
Relative Unrealized Profit/Loss is previously explained is an on chain metric which can be a very useful in asisting a trader to identify potential cycle tops and bottoms on a chart and it does this by taking the difference in the value of realized cap from the market cap.
An RUPL value of 0.75 or 75% and above is within the cycle top and is considered the highest price level in a bullish position hence it is seen as the profit taking level while a value of 0.25 or 25% and below indicates that a cycle low.
I will be performing a short term analysis on Bitcoin for a period of 8 years using the look into Bitcoin

SOURCE
As we can see from the RUPL chart above the asset started off in Jan 1 with an 11% increment in value and experienced movements on to different phases from Capitulation up until Euphoria.
The different phases that traders experience is being displayed by the chart so an analyst would have a heads up on what to expect and know exactly what phase he is in at the moment of his entry to a trade the different phases and their value is seen as listed below
- 75% upward signifies Euphoria
- 50% upward to 75% signifies Greed
- 25%(0.25) upward to 50% Optimism/Denial
- 0% upward to 25% signifies hope/fear
- 0% and below it signifies capitulation and accumulation
With the assistance of the RUPL we are able to see that on the 20th of NOV 2013 the the bitcoin asset was able to cross the Capitulation phase and successfully entered the Hope/Fear phase at 645 at 0% .
In the chart we can see that on march 21st and December 13 2013 qw two significant Top cycles clearly crossing the take profit range hence a rejection follows with a decline in value is seen to follow. This action happened again in 17 December 2018 clearly entering the Euphoria stage and a steady decline in price value is seen to follow.
Similarly A huge Dip is seen CLearly entering the Capitulation Zone with a reading of up -125% and this cycle bottom came immediately after the assets entered Euphoria state from an all time high of 87% to a rapid decline of -127%
The Price of bitcion has seen rapid growth and it is currently seen in the Optimism/Denial Zone which is currently at a reading of 49% 53,937$ as of 9th of October and this is seen from a trend reversal that occurred at 36% lately. The glory days of bitcoin are far from from over at the current rate the value is rapidly fluctuating i believe it still going to rise to a value up to Euphoria phase above 75% and decline again and this will keep on repeatedly happening
SOPR 3 years

Source
For the Sopr i will be making use of the glassnode For bitcoin analysis for a 3 years period
The Sopr reading is measured with a value of 1 as can be seen on the chart if the Rreading gotten from the chart is greater than 1 then a Local top and if the reading is below 1 then we have a local bottom
Although the chart at the end of 2018 was in a bullish trend generally the SOPR reading was at 0.995 with its value at 6,273$ and an all time dip within the 3 years range was seen in the chart as at 0.87 December 2018 with a value of 3,756$
In April 2021 we saw the chart peak at 63,602$ with an SOPR reading of 1.02 and a current SOPR reading of 1.003

Write down the specific use of Relative Unrealized Profit/Loss(RUPL), SOPR, and MVRV in the context of identifying top & bottom?
SOPR
- Can be used to identify local tops and bottoms
- A value above 1 can be interpreted as a buy signal and vice versa
- The SOPR can be used to identify gains and losses of an asset over a specific period of time
RUPL
The RUPL can be used to identify different phases a chart is in In
It can be used to detect profit taking zones assuming the value returns with an above 0.75 value and vice versa
MRVR
- It is used to identify higher tops and higher bottoms in a market where a value of 100 or greater than indicates the market to be in a bullish trend and vice versa
- Can also be used to tell if an asset is under valued or over priced
- Can also be used to confirm signals

CONCLUSION
The knowledge of On-chain metrics and how to manipulate and analyze them can hugely move the market in favor of the analyst. The abilit to understand and properly apply the RUPL, SOPR and MRVR can greatly help an analyst to know when is the right time to exit and enter signals.
CC: @sapwood
CC: @churchangel
Thank you for attending the lecture in Steemit-Crypto-Academy Season 4 & doing the homework Task-5
Unfortunately, we do not recognize your reputation because you have used bot/vote-buying serivces to grow your reputation.
Downvoting a post can decrease pending rewards and make it less visible. Common reasons:
Submit
How do i go about this sir. Is there a way to Undo it
Downvoting a post can decrease pending rewards and make it less visible. Common reasons:
Submit
Unfortunately, Rep can not be undone.
Downvoting a post can decrease pending rewards and make it less visible. Common reasons:
Submit