
DEFINE AND EXPLAIN IN DETAILS IN YOUR OWN WORDS, WHAT IS THE STRATEGY OF THE EMA + BREAKOUT OF THE TREND LINE

First of all, the EMA standing for Exponential Moving Average is a sub-division of a moving average indicator used to determine the average past prices of a particular asset for a specified period of time. So the EMA gives signal of the next market move relying of the recent price of an asset per time.
Then a trend line as the name implies is a line traders employ to determine whether the next phase of the market will take a bullish or bearish move as well as the strength of the market. So, the trend line ranges from either the highest point to the lower point in a bearish move or from the lower point to the higher point in the case of a bullish move.
In as much as the EMA indicator is a very reliable indicator to an extent it is also pertinent and adviceable not to use a single indicator as a standalone tool as a single indicator may sometimes be misleading or erroneous at thus, reliable result is achieved by combining another technical analysis or strategy for which in this case and for the purpose of this lecture, we will be blending the EMA Indicator with the breakout of the trend line. So, the EMA set at 100 period will help the trader determine the market trend in a more easier way. Whenever the price rises above the EMA, it is an indication of an upward trend where as when the price is below the EMA, it is an indication of a downtrend trend.
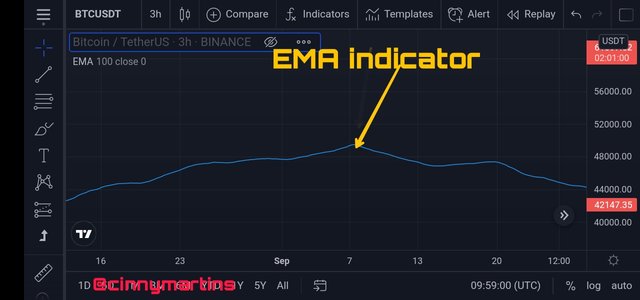
Now, talking about a trend line, it is determined by connecting the highest point to the lower point of an asset price. So whether the trend line is in a bullish or bearish end we await a breakout of the trend line from whence we will either make our Billy entry or sale entry.
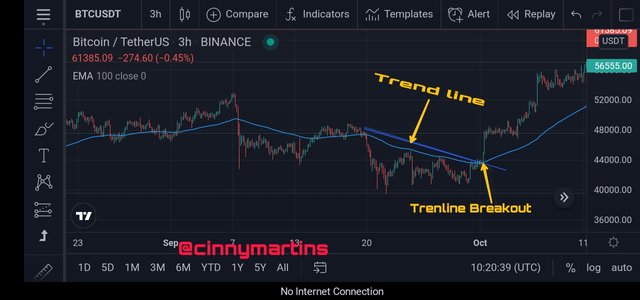
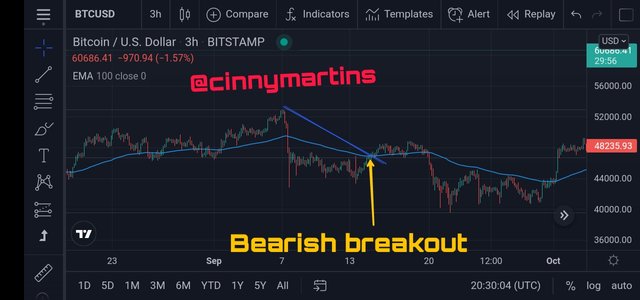
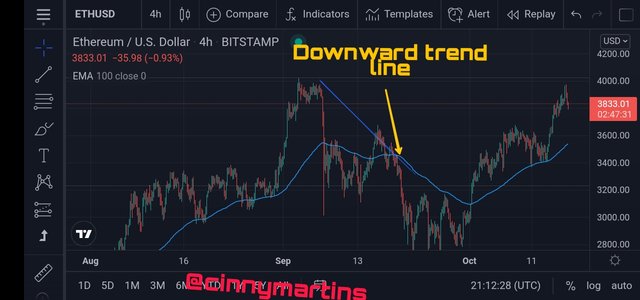
The image above which is BTCUSD chart on Tradingview platform complies with the combination of the listed analysis which is the EMA strategy+Breakout of the Trend line. Having identified all these as seen in the image above a trader can now take either a purchase or sell entry.

EXPLAIN IN DETAILS THE ROLE OF THE 100-PERIOD EMA IN THE EMA + TRENDLINE BREAKOUT STRATEGY?

This question will be explained knowing that the EMA indicator is one that relies so much on the past prices of an asset and we will be detailing EMA for 100 periods which is used to indicate EMA for the period of 100 days.
Far from this, we know that the EMA indicator has so many function but which is not limited to confirmation of a market trend ; so we first of all see a market trend on a particular direction but then we get to confirm the strength or weakness of such trend by confirming it with the EMA 100 indicator.
More so, we also look out for best entry position relying on the EMA-100 indicator. So when the price is above the EMA it signifies the best time to make a buy entry and if contrary , we take a sell entry position.
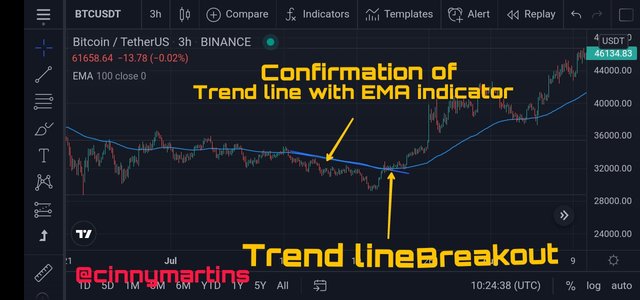
From the screenshot above, you can have a configuration of both the EMA+Trend line Breakout strategy and from here, we can easily extract the role of EMA-100 to these strategies. From the image, we could notice there is a slight downtrend as well as a steadiness and the of the trend line as indicated you will notice that the indicator showed an uptrend signal which landed to a Breakout of the Trend line and as seen it didn't take long the price followed the uptrend move.
So this simple illustration explain the trend confirmation using the EMA 100 indicator as the indicator had to confirm the slight downtrend on the price before taking an upwards move.

EXPLAIN IN DETAILS THE ROLE OF THE "TREND LINE" IN THE EMA + BREAKOUT TRENDLINE BREAKOUT STRATEGY?

The trendline is a very important tool employed by every trader as long as trading is concerned and work hand in hand with the EMA as it is used to identify the price movement of an asset.
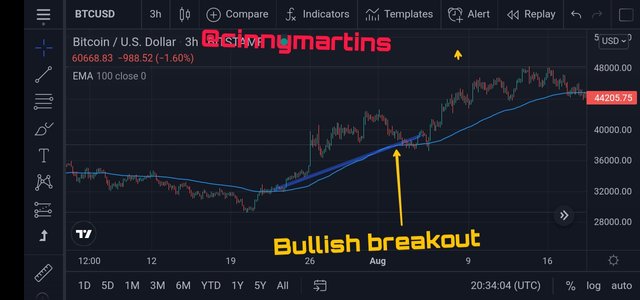
As per the role of the trend line in the EMA+breakout trendline strategy, it is used to look out for a break in the trend line either in a buy or sell signal depending on the move of a particular cryptocurrency per time. So, if for instance we have the price of an asset running above the EMA, we will look out for a buy and then wait for the price to make clear breakout from the trend line so any point where the candle representing the asset price breaks and is above the trend line and the EMA we will make a buy entry.
Conversely, if the price of an asset is below the EMA, it is the time to look out for sell signal and we need to wait for the price to break from the trend line. As soon as the price breaks out of the trend line and the price goes below the EMA, we make a sell entry.
Conclusively, To determine a downwtrend of an asset it must have series a lower low. But in the case of an asset uptrend, there must be a creation of series of higher highs.

EXPLAIN THE STEP BY STEP OF WHAT NEEDS TO BE TAKEN INTO ACCOUNT TO EXECUTE THE EMA + TRENDLINE BREAKOUT STRATEGY CORRECTLY?

It is Pertinent to understand that every trader does carry out a technical analysis before entering the market for either a buy or sell entry and to carry out this technical analysis there are due protocol to be observed accordingly. So to carry out the EMA + trendline breakout strategy perfectly, the following step are to be rightly taken:
Step 1
Place the EMA of 100 period. By this period we are covering the average price action of the particular crypto currency we choose to work with 100days.

Step 2
We try as much as possible to visualize the market structure by simply identifying the market setback and impulse. So, if the EMA happens to be placed or found above the price, we found a structure replicating series of the lower low in a downtrend.
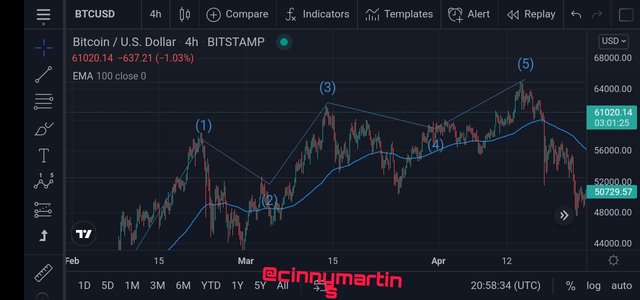
And when the EMA is below the price, we look for a market structure replicating a higher and a lower high in a uptrend.
Hence the idetifying the maximum and minimum point in the trend
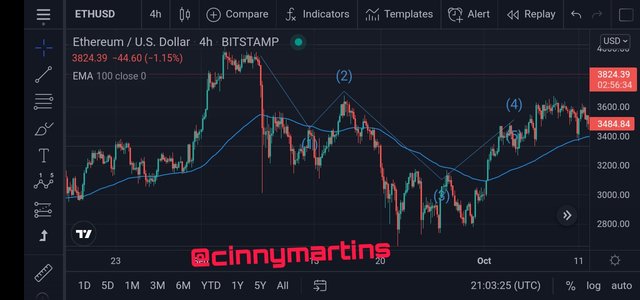
Step 3
After identifying the current trend and the market structure the next thing we need to do is to place our trend line to make our next entry into the market. When the current market trend is up, we just need to place our trend line downward then join it to the highest point of the market price.
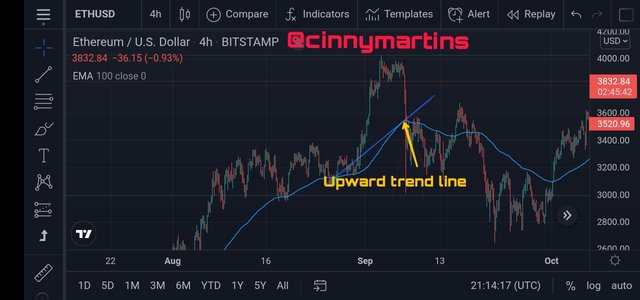
But when the current market price is down , we place the trend from the upwards line and then join it to the lowest point of the price and then wait for a breakout of the trend line.

WHAT ARE THE TRADE ENTRY AND EXIT CRITERIA FOR THE EMA + TREND LINE BREAK STRATEGY?

The first thing to identify for the entry criteria is whether the price is above or below the EMA. Identifying the market structure using the harmony of the asset movement and recreating series of higher or lower highs or lows. Then we draw the trend line relying on the current market price or trend. And finally we wait for the price to break the trend line above or below and then make a sell or purchase entry.
Fast Forward we have lateralization of price action. It is important to locate perfect market structure because if the price is lateralized, we can't enter the market that easy so we have to exercise patience in other to get the best signal.
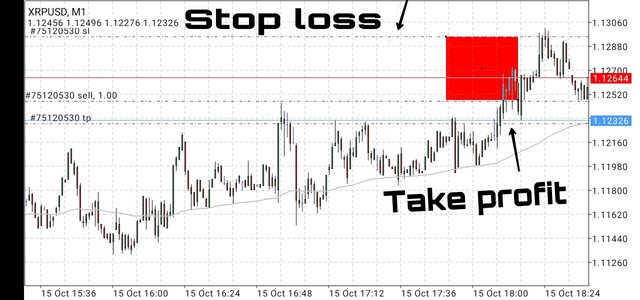
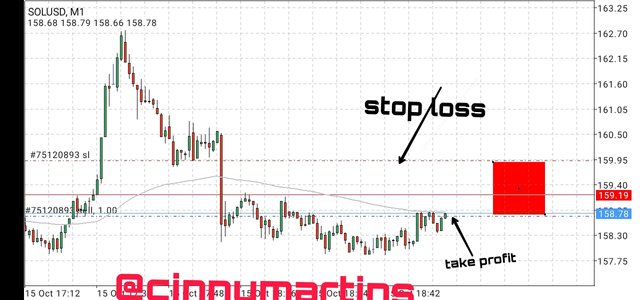
So, now we have the trend defined, the harmony of the movement and the trend line perfected and we make our entry. we then place our take profit /stop loss at a ratio of 1:1 above or below the last maximum or minimum point of the asset.


Here, we have the details of my trade:
For the Bullish trend,
And this for the bearish trend
Cc.
@lenonmc21
