

INDICATE THE CURRENT VALUE OF THE PUELL MULTIPLE INDICATOR OF BITCOIN. PERFORM A TECHNICAL ANALYSIS OF THE LTC USING THE PUELL MULTIPLE, SHOW SCREENSHOTS AND INDICATE POSSIBLE MARKET ENTRIES AND EXITS.

Firstly, Puell multiple is an indicator used to determine the revenue generated by Bitcoin miners and also a way of gauging market cycles from the mining perspective. Currently, after the last Bitcoin halving, miners were being rewarded with 6.25 BTC for successfully validating a block.
Bitcoin miners after they have generated those revenues, are sometimes compelled to sell off their income in a bid to maintain mining costs in markets where price are deeply volatile. It is with those revenues they've generated that they will rely on to influence price per time.
The Puell multiple can be determined by dividing the daily issuance BTC in does in dollars by 365 day moving average of the daily issuance value.
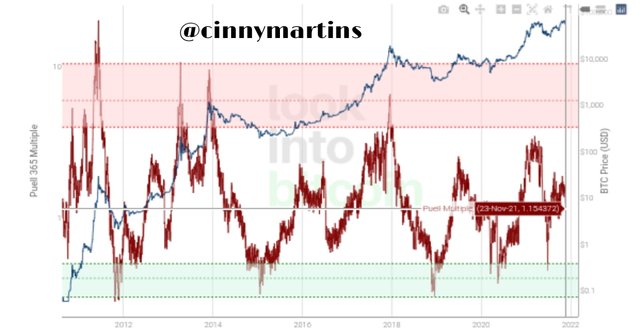
As at the day of making this post,
As at the day of making this post, the current value of the Puell multiple indicator for BTC was 1.154372.
Next is to carry out a technical analysis of LTC using Puell multiple indicator of which I will be analysing the LTC asset using the glassnode studio.
With Litecoin cryptoasset, it allows avenue to pay people anywhere around the world without the need of a third party processing the transaction. Just like Bitcoin, Litecoin token involves a creation process known as mining and its miners are as well rewarded with Litecoin for actively participating in the mining process. The sum of its halving is simply to sustain its purchasing value. The most current and last Litecoin halving occurred on the 5th of August 2019 after which the mining reward was halved from 25LTC to 12.5LTC per block.
Ultimately, there was 84m Litecoin in circulation but as as August 2021, it was 66.8m Litecoin in circulation.
To analyze Litecoin using Puell multiple is synonymous to identifying whether its miners sell off the rewards generated from mining in other to reduce the mining cost bearing in mind that the Puell multiple indicator considers mostly the supply economy of an Ecosystem.
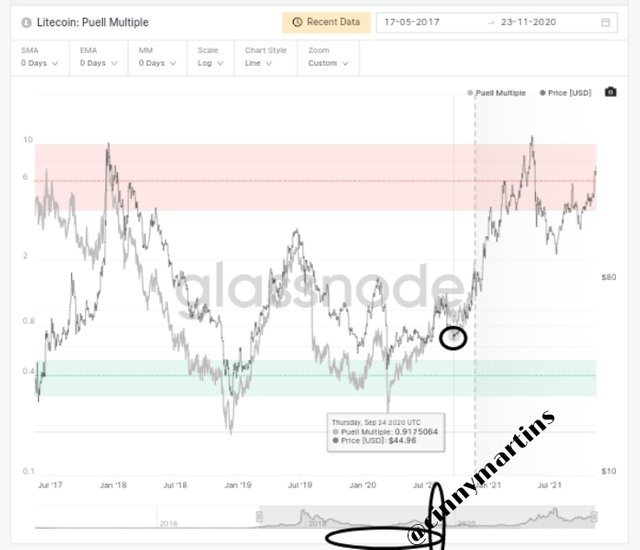
The Puell multiple can be used to take an entry position as well as exit the market. As we have previously learnt, this Puell multiple represented in a graphic chart can be used to identify the emotion of the miners and it is their emotion that determines the current market position or its future position at most. If the Puell multiple indicator slopes downward, it indicates a buying opportunity in the market.
The image above depicts a good entry position. This is a good buying position and make huge profits in the nearest future. Now, from the image above, which was captured in 24 September 2020, the Puell multiple as at that date was 0.9175064 while the Litecoin price was $44.96 on the said date.

The Puell multiple indicator can also be used to identify a good selling position and make good profits. As can be seen seen above a good selling position is best identified at the point where Puell multiple indicator lines rises above the asset price. The exit position taken was 23 December 2017 has the Puell multiple at 6.44875113 and Litecoin price was $282.09.

Explain in your own words what Halving is, how important Halving is and what are the next reward values that miners will have. When would the last Halving be?

Halving means the reduction in the original amount of a thing. so, the halving process is a process of dividing the rewards of successful mined cryptocurrencies into two. The halving event normally comes with a strong influence on the price of cryptoassets as demand increases as a result of decreasing liquidity.
Halving basically is an automated process or repetitive occurrence that takes place every four years especially in the case of Bitcoin. Upon the occurrence of this event, cryptoassets in circulation is been halved and same as the reward of miners for validating blocks. The goal of halving is to ensure that the amount of the existing Bitcoin is completed. The halving process comes with opportunity to accumulate bitcoins as more is been created. Currently, there are 86% of bitcoins in circulation but before the halving process is completed, the 21,000,000 bitcoins in circulation would be complete.
The halving process contributes significantly to the value of Bitcoin as earlier said, the halving process comes with a strong reduction in the reward of miners, on the long run, the limited numbers issued to holders will amount to a lot and by then they would have enough money to bank on.
It is also of great importance to investors. Remember I said that the halving process comes with reduction, this can be an opportunity for a trader to maximize such that they can make huge profits as demand increases in the nearest future.
Another importance of halving is that it curtails inflation to the barest minimum and this is made realizable because of the limited number of bitcoins in stock.
The first Bitcoin halving took place in November 2012 prior to which a reward for a block mining was 50 BTC and after the halving, the reward was halve to 25BTC.
The second halving took place in 2016 and the reward was halved to 12.5BTC per block.
The last Bitcoin halving took place in may 2020, the reward was halved 6.25BTC.
The fact still remains that Bitcoin halving will keep rotating every four years and the implication of this is that the reward for mining will keep dropping until bitcoin reaches 21,000 000 total supply which is estimated to occur in 2140.
what are the next reward values that miners will have.
Having established the already occurred halving events, I will outline the next available halving process and its reward values for miners in a tabular form.
| Year | Block No | Reward | No of BTC Reward |
|---|---|---|---|
| 2020 | 630.000 | 6.25btc | 1.312.500btc |
| 2024 | 850.000 | 3.125btc | 656.250btc |
| 2028 | 1,050.000 | 1.5625btc | 328.125btc |
| 2032 | 1.260.000 | 0.7812btc | 164.062btc. |
The halving will continue to rotate until the last halving year 2140 when the 21,000.000btc will be completed.

Analyze the Hash Rate indicator, using Ethereum. Indicate the current value of the Hash Rate. Show screenshots.

Here again I will be using the glassnode studio to perform this analysis. The hash rate indicator is used to determine the mathematical power imputed by miners to validate blocks and verify transactions. This indicator is used to measure the exact number of calculations a given machine can process in the BTC network each second. The good thing is, the higher the hash rate of any given machine, the higher the chance of successfully mining a block and receiving rewards. For this reason, miners do collaborate in mining pools to combine their machines computational powers.
The hash rate identifies the number of calculations, validations and even verifications carried out which all the systems connected to the Blockchain perform each second and combining its result into a sole hash value.
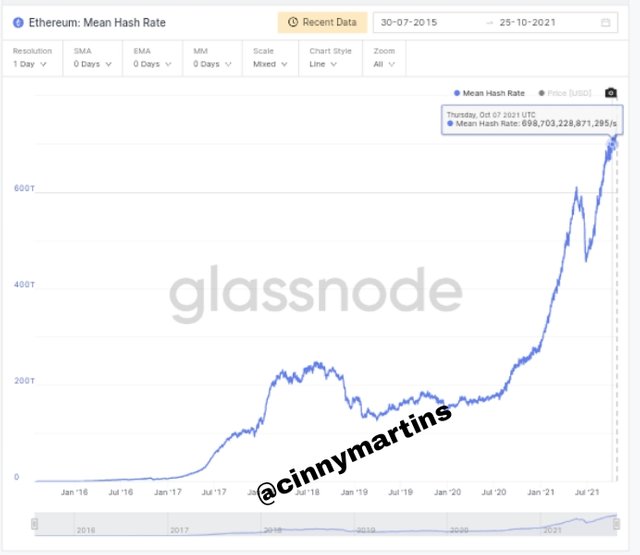
The image above shows how many hash rates currently running on the Ethereum network. As at October 7, the ETH mean hash rate was 698,703,228,871,295/s. This entails that there is a moderate increase on the hash rate.
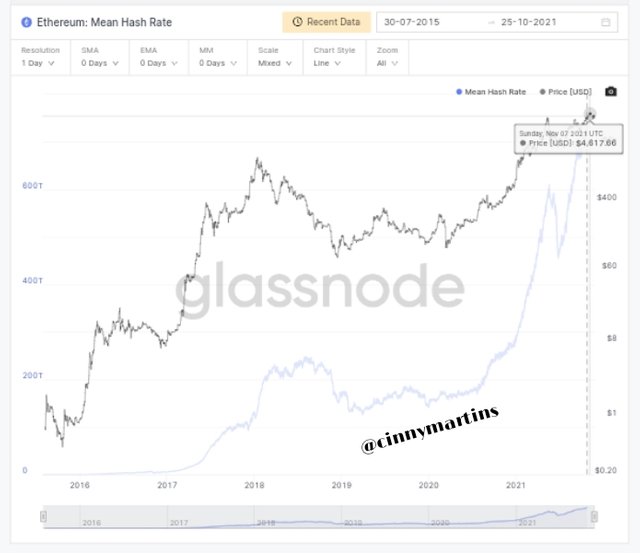
A keen look at the graph above too you will notice that the price of ETH has gone up to a reasonable extent which as at 7 November was $4,416.66. The price of ETH is linked to its hash rate as the increase recorded so far in the price rate is what reassures investors that more and more persons are getting involved in the computing process of the ETH Blockchain.

CALCULATE THE CURRENT STOCK TO FLOW MODEL. EXPLAIN WHAT SHOULD HAPPEN IN THE NEXT HALVING WITH THE STOCK TO FLOW. CALCULATE THE STOCK TO FLOW MODEL FOR THAT DATE, TAKING INTO ACCOUNT THAT THE MINERS REWARD IS REDUCED BY HALF. SHOW SCREENSHOTS.

Taking a step into the cryptocurrency investment is a very intimidating one as cryptocurrencies are unpredictable Which makes it challenging for investors to make impressive investments decisions, talking about decisions one can as well benefit from the stock to flow model to make more informed investments decisions. There are many price predictions model for Cryptoassets but stock to flow happens to be the most popular of them as it predictions has for long lines with bitcoin price changes over the years.
The stock to flow model provides a more comprehensive approach to predict assets value changes. And it does this by measuring the current stock of a given asset against how much is been mined in a year. Now when the ratio gets higher it indicates scarcity which will in turn result to a higher value.
The stock to flow formula to measure future value of an asset would be:
SF=stocks/flow
As at the time of making this post 25 Nov 2021 there are currently 18,883,175.00 btc in circulation having known that bitcoin halving occur every four years or upon the completion of 210,000 blocks.Currently, the reward of owners is 6.25btc as at 2020 till date.
Total of 144 blocks are mined daily and in a while year we have 52,560 blocks mined.
Now, SF=stock/flow.
Where stock =18,883,175.00btc
Flow= block reward×block production per year.
We would have: 6.25btc×52,560= 328,500 blocks per year
Stock/flow= 57.483.
Now, to obtain the value of the indicator line which is the line that indicates the stock to flow indicator. The formula would be:
Stock to flow model= 0.4×SF^3
=75.976,322439btc.
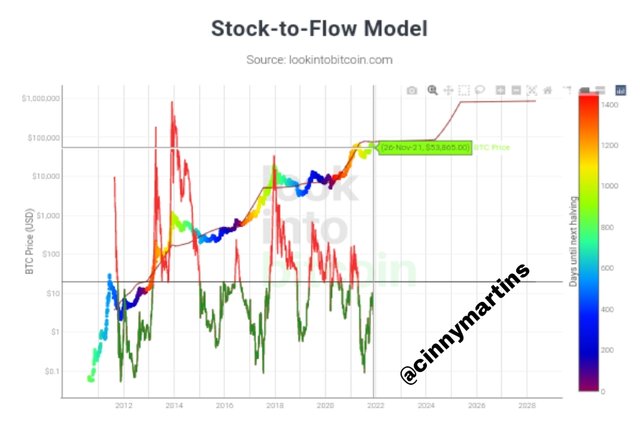
The next BTC halving which is presumed to take place in 2024, the miners reward will be halved to 3.125btc and when this is done we would have 656,250 new BTC issued and this development would resketch the initial stock to flow model formula. Worthy of note is the fact that the rate at which Bitcoin is mined would be reduced to the barest minimum in the next halving and this would result to higher value in the price of BTC.
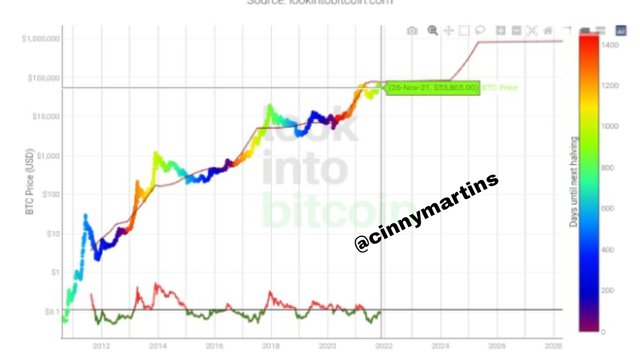
To calculate the stock to flow model for the date, taking into account that the miners reward is reduced by half and noting that the reward for successfully mining to be 3.125 btc. Also, we would have to add the 18,883,175.00btc in circulation to the 656,250 new BTC to be issued in 2024. We have total of 19,539,425btc for 2024.
Back to calculation,
SF= Stock/ flow.
Where stock= 19,589,425
And flow= Block reward×block produced yearly.
=3.125btc×52,560=164,250.
=19,589,425/164,250
=119.265905
SF= 119.266 to 3sf.
Having the stock to flow model for 2024 to be stock to flow model= 0.4×sf^3
0.4×119.266^3
Stock to flow= 684.211.05 BTC price.

CONCLUSION

In conclusion, the stock to flow model indicator is a very impressive tool that guides investors in making informed investments decisions. I got to learn alot on how to use this tool. Courtesy of this tool, traders can take good entry and exit position in order to take favourable trades.
It was more than a study, it is an adventure and I really enjoyed the amazing lecture delivered by Prof @pelon53.