

EXPLAIN IN YOUR OWN WORDS THE CONCEPT OF DOUBLE TOP, DOUBLE BOTTOM AND WEDGES

Double top
This concept is not far fetched but can be found within charts which is basically used by traders in a bid to analyze the market movements. The double top principle is replicated by letter Mon the price chart. The double top usually occur when there is an uptrend and the two highs took place in a relatively short period in that the trend hits resistance level twice and reversed downwards.
To be able to detect this pattern on the chart, the trader must be able to identify two maximum peaks on the price chart and then a drastic second fall following which then leads to a bearish move afterwards. This pattern is a very effective one which the proper and accurate application yield productive trades. However, it is advisable to say that traders are not endulged to rely on a single technical analysis as a standalone tool to make trades this is because the double top pattern may not be accurate at all times and may possibly mislead the trader into entering the wrong trade.
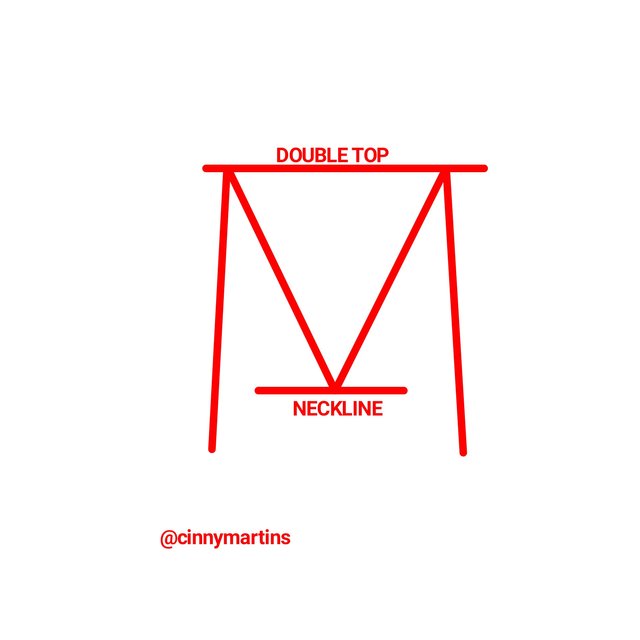
The image above is an indication of double top pattern. I was able to highlight the 2 maximum points which symbolizes lines hitting at the top of a given price chart and this can be represented in any chart depending on the time frame a trader is working with. As illustrated above, it form a letter M and after the second to hits the resistance line, it will then take a bearish move as represented above.
DOUBLE BOTTOM
This is contrary to what can be obtained in double top or replicated on the chart. This pattern is usually represented in letter W. Now, in contrast to what we have in double top, the double lines hit the support level twice consecutively and finally take an upward move. The point where the second line hits support line is a good buying position as the chances of the market taking an upward trend afterwards is really high. In otherwords, the double bottom pattern gives a bullish signal. Thus, after the minimum peaks which form the support line has been identified in the price chart, the trader may make a but entry. The reliability of this movement can be confirmed by waiting for the formation of additional 3 candles.
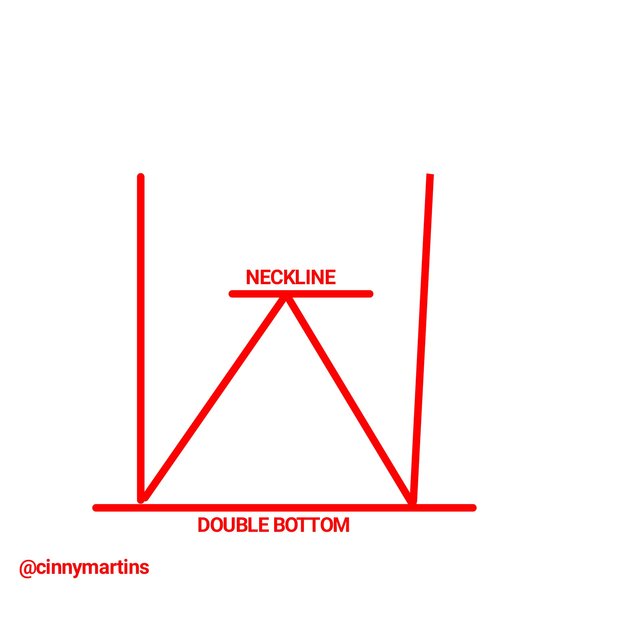
Above is an illustration of double bottom and which obviously has the formation of letter W . From the image, the former movement was a downtrend in between the lateral movement up until the second line which is the double bottom was formed and the trendline moved upward.
WEDGES
Similar to every other technical analysis which traders use to analyze the market in a bid to understand the future trend of the market. It if formed when two trendline converge. Wedge is of two classification: The rising wedge which forms when the wedge points upward and the falling wedge which forms when the wedge points downwards.
RISING WEDGE
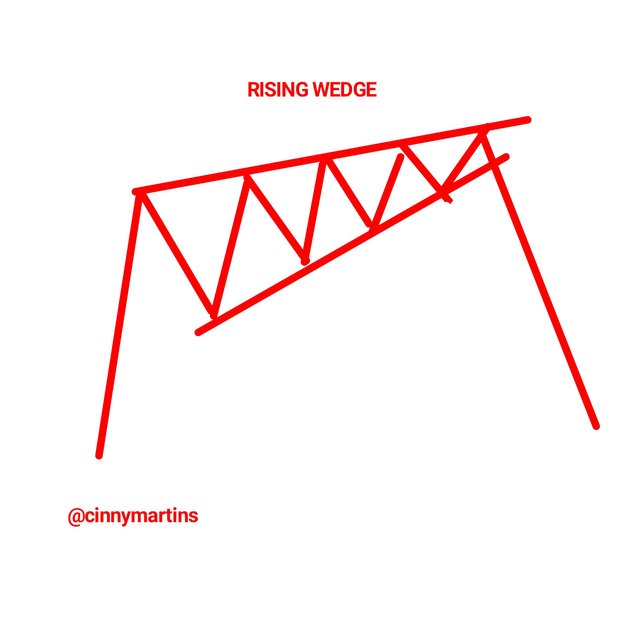
This is formed when two lines converge to take an upward movement. When the patterns get to its peak, it is an indication that the traders should expect a drastic fall in the price of an asset. The bearish move that occurs here is occasioned by the weakness in the buyers strength. The market tends to bear the moment sellers take over the market.
FALLING WEDGE
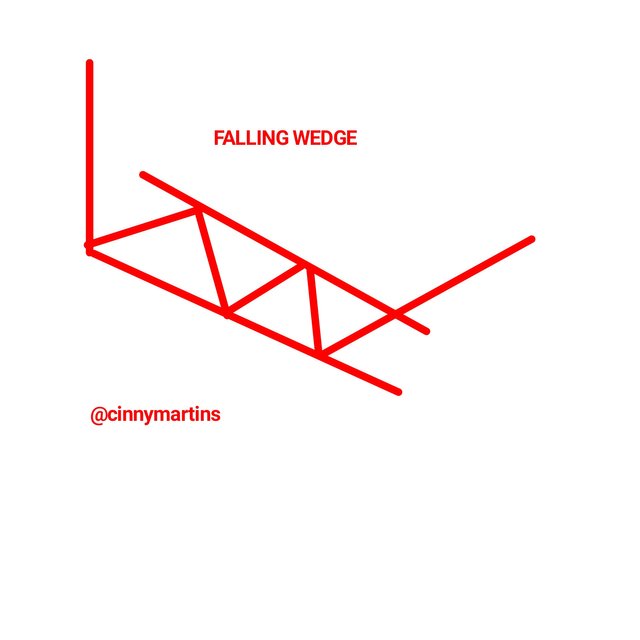
The point has been made that a falling wedge is formed when the wedge points downside and is accompanied by a rise in volume. Contrary to what we have in rising wedge, two lines converge to take a downward movement and as soon as a breakout occurs, the price tends to go bullish. This could also be an indication that the buyers have taken over the market.

MAIN DIFFERENCE BETWEEN THE DOUBLE TOP AND THE DOUBLE BOTTOM. SHOW SCREENSHOTS

- In a double top just as the name implies, there is a formation of double tops at the maximum peak in an uptrend which forms the resistance line.
Whereas in double bottom, the formation lies at the minimum peak in a downtrend which forms the support line.
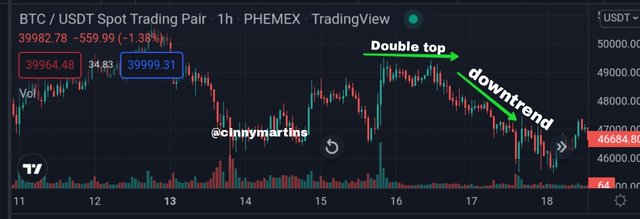
As represented in the illustrations above, the double top is formed by the letter m of which the top forms in an uptrend and after which it takes a slope downward. However, to confirm this movement, The trader have to for extra 3 candles to drop.
But in a double bottom as illustrated in the image above, which is represented by letter W. This pattern forms in an uptrend and as soon as second line hits the support line, the pattern reverts to the uptrend. The trader should as well confirm this move by waiting for extra 3 green candles before entering trades.Basically in a double top pattern, the volume drops while in a double bottom pattern, the volume goes up. This is simply another tool to complement and confirm a technical analysis.
In a double top pattern, the trend changes from uptrend to downtrend the moment the last line hits the maximum price point.
While the reverse is the case in a double bottom where the price pattern which was initially the on a downtrend moves up the moment the last and the double bottom hits the support line and this point makes a good buying position for the trader.


HIGHLIGHT THE DIFFERENCES BETWEEN BULLISH WEDGE AND BEARISH WEDGE
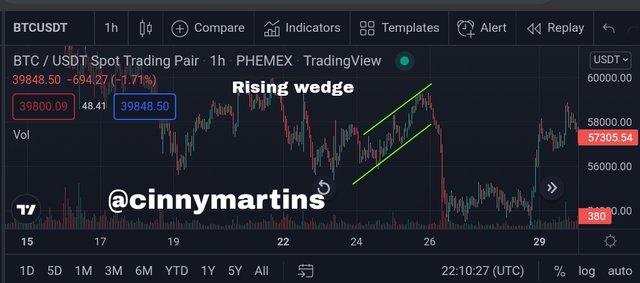
Rising wedge
This is known as the bullish wedge and it is usually formed when two lines converge to take an upward movement with series of higher highs on the price chart. One striking thing about this pattern is that at the occurrence of a breakout, the trend tends to change direction towards the bearish trend.
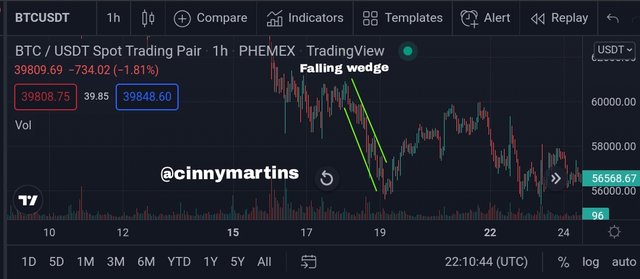
Falling wedge
Also known as a bullish wedge. Conversely, it is formed when 2 trendline converge to take a downtrend movement. When the breakout occurs, basically at the support line, there trend to be a change of direction to the upward movement.
See chart below.

EXPLAIN THE VOLATILITY THAT USUALLY EXISTS WITH RESPECT TO THE VOLUME IN WEDGES. WHEN IS THERE USUALLY MORE VOLUMES? WHAT HAPPENS IF A PULLBACK BREAKS THE SUPPORT OF A WEDGE?

As earlier stated, the wedges in crypto are categorised into two: Rising wedge and falling wedge.
In the rising wedge, we see a progressive weakness of the market. At that point, what happens is that the price of the assets reaches its peak that the buyers lose control of the market. This is the point where sellers take over the market and the trend tends to change from the bullish to the bearish end. Whenever there is a rising wedge, the volume is usually low which is evidenced when the support line is broken by the pullback.
Falling wedge
This is usually formed at the point where sellers strength is exhausted and buyers are ready to take over the business. Here, the price of an asset reaches the minimum peak and the trend reverts from bearish to bullish move. The volume increases drastically in a falling wedge although it doesn't have the same moment at the point of formation of the pattern.

FIND AND ANALYZE THE DOUBLE TOP PATTERN ON AT LEAST 2 CHARTS. SHOW YOUR OWN SCREENSHOTS.
Double top first analysis
For this analysis, I will be using an ETHUSDT chart and below is an illustration that will guide on the analysis.
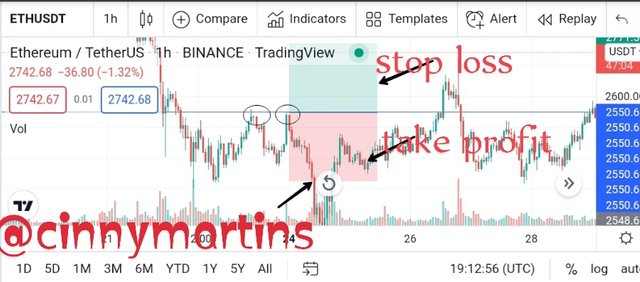
As seen above, the chart timeframe was set on 1h and one the circled Area where the double top pattern was indicated, you will notice there is a repetition of pattern in form of letter M from which the first arm hits the resistance point and swayed back a little and upon the second reach, the next move got a bearish signal and the market changed direction.
Double top second analysis
This part of the analysis is represented on a BTCUSDT 1h timeframe chart represented in the image below.
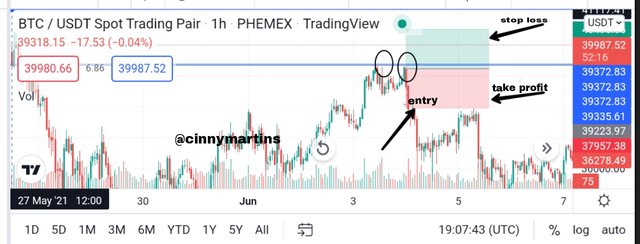
Just like what is realized above, the double top pattern is an indication of an exhaustive buying strength which is signalled by a bearish move on the price chart. Still, it is replicated by the letter M and shows a downward move of the price as a result of sellers taking over the market.

IMPORTANCE OF PATTERNS IN TECHNICAL TRADING

What more guides the move and entries of traders other than patterns in a technical trading. Ordinarily, the crypto market is a volatile one with prices progressively fluctuating and with this inconsistency in the price of cryptos assets, you find out that it is of essence for the trader to employ patterns so as to help them analyze and predict the movement of cryptos which are represented on the charts and known to repeat histories of price movement replicated on those charts.
These patterns are basically figure formed in price charts. Traders bank on patterns to take their trading decisions as to when it would be proper and beneficial to enter market and buy or exit market to sell their accumulated assets. There are many approches that currently exist which can be employed in trading.
Moreso, traders and analysts rely on patterns to make predictions on the likely movement or future price of the assets within a given timeframe. And with patterns, the traders are armed with immunity against losses in the market or at least reducing risk of loosing ones asset to the barest minimum. Again, the trader is not unaware of what the possible move of the market would be having understood the move of the patterns on the chart.

DO YOU FIND IT EFFECTIVE TO USE PATTERNS IN TRADING

I will start by saying that when I started my journey as a new investor in crypto trading, the first tool I solely relied on was the pattern. Prior to that time, I had the basic knowledge of asset price repeating history and all I could do is study a given pattern previously on the chart and compare it with the current pattern on the current chart and then I make my predictions on the basis that the initial movement will replicate itself and go ahead to make sales or purchase as the case may be. As short sighted as I was then, I was able to amass a satisfying profit on every trade I take just by making predictions relying on patterns on the chart.
On this note, there are quite much to be achieved using patterns and most time I wonder; if only patterns could make such impact like this, what more could other tools when combined achieve?. In all, the success rate a trader can achieve in trading with patterns is really high and as such, patterns are said to be very effective in trading.
Gracias por participar en la Sexta Temporada de la Steemit Crypto Academy.
Espero seguir corrigiendo tus futuras asignaciones, un saludo.
Downvoting a post can decrease pending rewards and make it less visible. Common reasons:
Submit