

DEFINE TD SEQUENTIAL INDICATOR IN YOUR OWN WORDS.

In our recent studies in indicators, we've learnt that Indicators are forms of technical analysis or trading tools which traders employ that signals or supports their trading decision per time as to when to make a buy or sell entry.
For this assignment, my main focus will be on a special kind of indicator which is the TD sequential Indicator. This indicator is so called Followed by its developer Tom Demark so, in full the indicator is known as TOM DEMARK SEQUENTIAL INDICATOR.
The TD sequential indicator basically informs us when the trend on a chart is running out and the reversal point of an asset price. Thus, this indicator provides support level and resistance level in a chart which guide the traders in making their trading decisions overtime.
Far from this, the peculiarity of this indicator is in the fact that it constitutes a number count which is usually formed below the candle when the trend is taking a downward move and above the candle when the trend is uptrend.
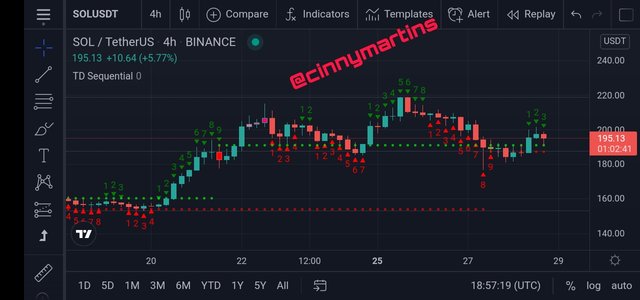
The indicator consists of 2 patterns:
- TD setup
- TD sequential
While the TD setup is a pattern formation and a shorter duration part of the sequential TD. The numbers count from 1-9 in TD setup as the pattern is formed by 9 candles. TD sequential mostly used by large investors in combination with the TD setup. This indicator can be used to identify changes in trends in the crypto market and it is most favourable for short term traders.

EXPLAIN THE PSYCHOLOGY BEHIND TD SEQUENTIAL. (SCREENSHOTS REQUIRED)

In using indicators, a trader should not just wake up and apply indicator to his chart; this may lead to a colossal loss of fund rather, he should have a label of mastery of that particular indicator and know when to apply it.
In explaining the psychology behind a TD sequential indicator, we ought to have the consciousness that investors have the tendency of either making profits or losses. But, here we have the indicator which although does not offer 100% accuracy but can be relied upon to a great extent.
The TD sequential indicator has several phases which the investors can work with but the two most used phases are:
- Setup phase
- Countdown phase.
The indicator mostly uses the candlestick patterns as it indicates the movement of the price with the candle count bearing in mind as we earlier said that TD sequential indicator can be used to identify exhaustion of a trend as well as market reversal.
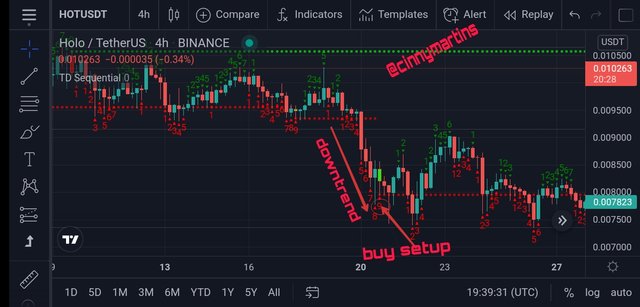
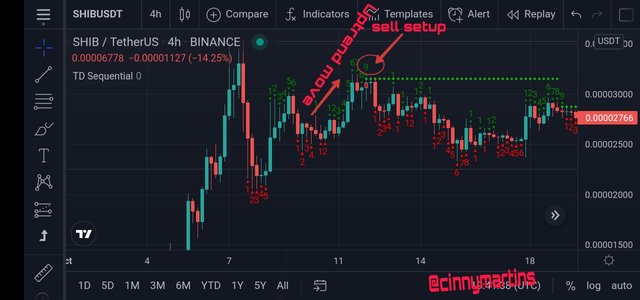
Having explained the little about the countdown phase, I'd like to note that the setup phase is further categorized into a Buy setup and a sell setup. The buy setup takes place when the price of an asset a downward trend while the sell setup occurs when the asset takes an upward move.
Ordinarily, the TD setup phase constitutes a 9 numbers count either above or below the candle of which there could possibly be a market reversal after the 9 numbers count. Now, in a TD buy setup in which the market must take a downward move and those formed below the candles so that after the 9th number, the investor can anticipate a market reversal or correction. The TD buy setup is explained in the image below and just as the name implies, the investors can take a buy position.
In a sell TD setup, where the trend direction must be upward and the numbers above the Candlestick patterns. After the 9th number, the trader can expect a market reversal and at this point, taking a sell position becomes the best entry.

EXPLAIN THE TD SETUP DURING A BULLISH AND A BEARISH MARKET. (SCREENSHOTS REQUIRED)

Basically there are 2 configuration options in the TD sequential indicator which is the purchase and sale. In this part of the question, I will be explaining the workings of the TD setup in a bullish and bearish setup.
In bearish market
The TD indicator can be used to analyse the market. To identify a bearish setup using the TD sequential indicator the trader must first of foremost as the indicator to his chart having in mind that the indicator is replicated by numbers formed above or below the candles. Now, to make a purchase order, it must be done after the asset analyzed has taken a price fall spontaneously.
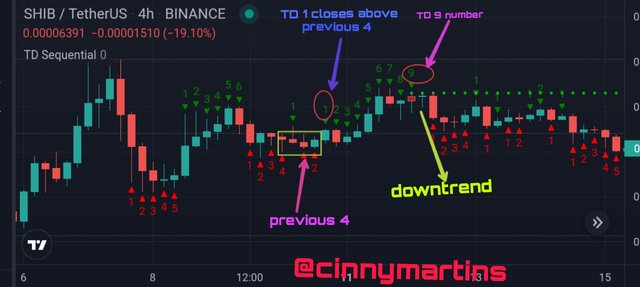
The bearish setup begins the moment a change in direction takes place from downtrend to uptrend meaning that we identify a bearish market once a bullish sets up after periods of significant downtrend move. As part of the criteria to know that the market is bearish we need to study the number counts on the chart to identify a candle with number 1 which closes above the previous for candles taking a bullish direction.
Another criteria is that after the 9th candles count, there should be a reversal.
In a Bullish market
Conversely, the price of digital assets must take a downward move in a bullish market. When the price is taking a downward move and we identify a reversal in trend direction, we identify a bullish market.
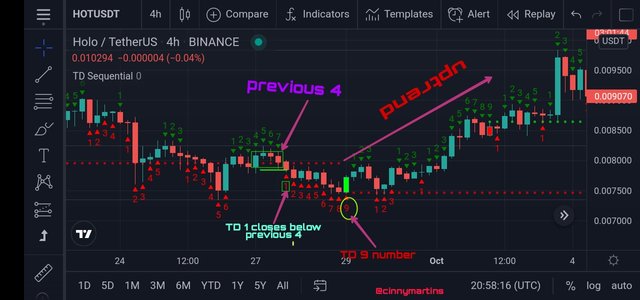
Another criteria to now is that from those number counts formed above or below the candles, the number 1 candle should close below the four previous candles for that period and the next candle after the TD 1 candle which is the number 2 should have preceding candles that would take a downward move.
Lastly, after the TD candle, there should be a reversal in the market towards the bullish end.

GRAPHICALLY EXPLAIN HOW TO IDENTIFY A TREND REVERSAL USING TD SEQUENTIAL INDICATOR IN A CHART. (SCREENSHOTS REQUIRED)

Just like every other indicator, the TD sequential indicator has this special feature of identifying market reversal or correction. I will be using the Tradingview chart to explain how to identify these reversal using a TD indicator.
Trend reversal in an uptrend move
In an uptrend, it simply indicates that there's much demand over supply and that the digital assets tend to be taking an upward move simply because the buyers are the ones in charge of the market at that point but being that the cryptocurrency market is volatile in nature, there comes a time when the sellers will overtake the market and this is usually the point when supply will predominate demand. This is the market reversal point from uptrend to downtrend.
However, TD indicator can be used to indicate such market reversal overtime in the crypto market. And for you to identify a reversal in the market using TD sequential indicator firstly, you need to look out for TD 1 candle and which the closing must be above the close of the for previous candles.
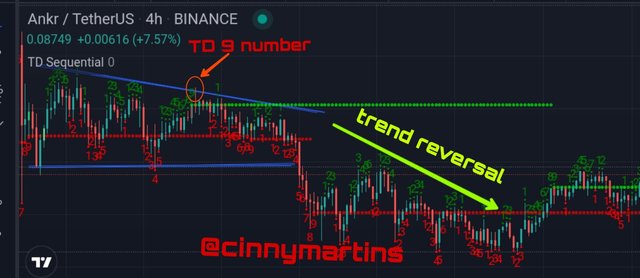
From the image above, it can be seen that the buyers were in charge of the market when it rallied upwards and only took a reversal when supply outweighed demand. Now, from the image it can be observed that the TD number 9 signalled that a reversal is coming and after reaching a maximum point, the assets price started falling gradually.
Trend reversal in a downtrend move
In downtrend, buyers have accumulated enough assets and at this point, they are exhausted and have resorted to distributing their assets. Now, the sellers have taken charge if the market.
And contrary to what can be seen in an upend reversal is that for an investor to identify a trend reversal in a downtrend, the TD number 1 candle should close below the previous four candles in a downtrend direction until the TD 9 candle is formed. This is the point where the trend reverses taking an upward move.
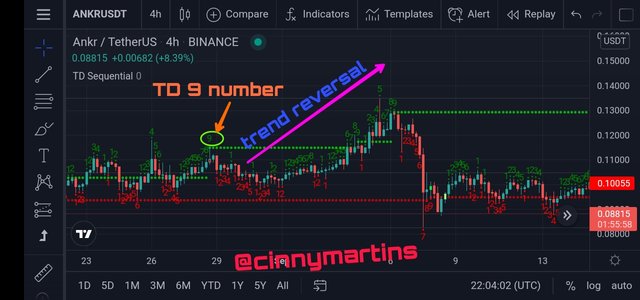
You can rightly see from the image above that the market was trending downward until the TD 9 candle occurred where it now took a reversal and started trending upward.

USING THE KNOWLEDGE GAINED FROM PREVIOUS LESSONS, DO A BETTER TECHNICAL ANALYSIS COMBINING TD SEQUENTIAL INDICATOR AND MAKE A REAL PURCHASE OF A COIN AT A POINT IN WHICH TD 9 OR 8 COUNT OCCURS. THEN SELL IT BEFORE THE NEXT RESISTANCE LINE. (YOU SHOULD DEMONSTRATE ALL THE RELEVANT DETAILS INCLUDING ENTRY POINT, EXIT POINT, RESISTANCE LINES, SUPPORT LINES OR ANY OTHER TRADING PATTERN SUCH AS DOUBLE BOTTOM, FALLING WEDGE AND INVERSE HEAD AND SHOULDERS PATTERNS.)

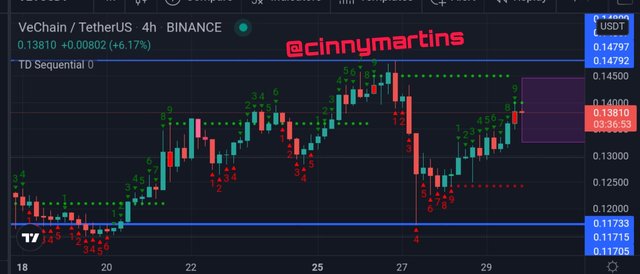
For this task, I carried out a technical analysis using a TD sequential indicator on a 4h chart on Tradingview platform where I marked out the resistance and support level. Now, as instructed in the assignment, I placed my entry at the exact point where TD 9 occured
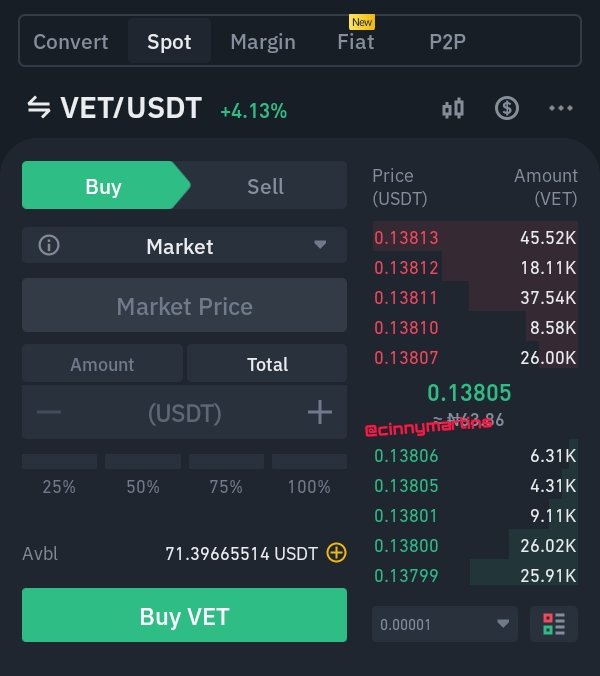
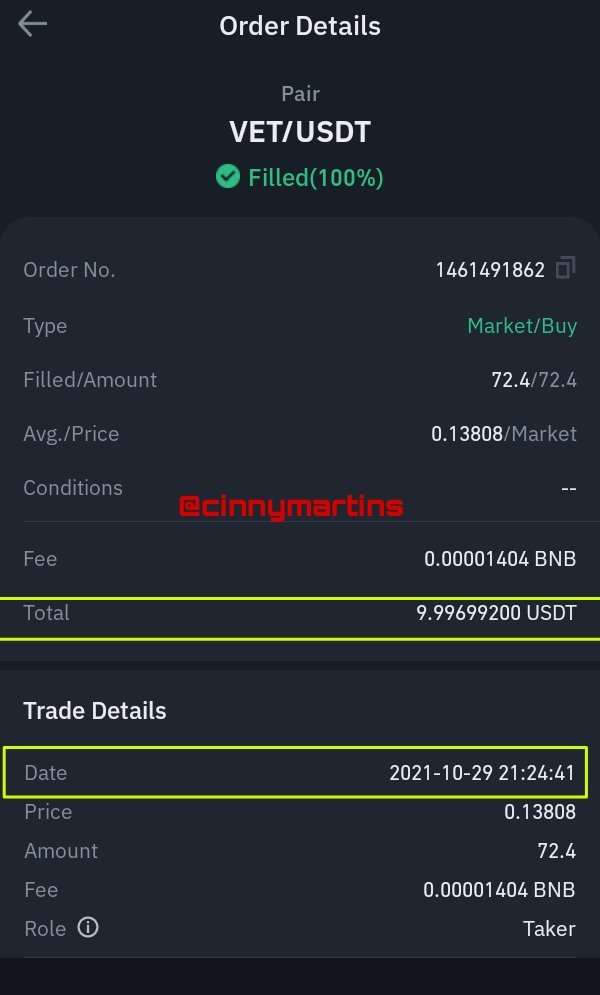
And again I had to carry out a real purchase using my BINANCE exchange from which I bought at the exact price where the TD 9 occured as I stated earlier and below are the details of my transactions.
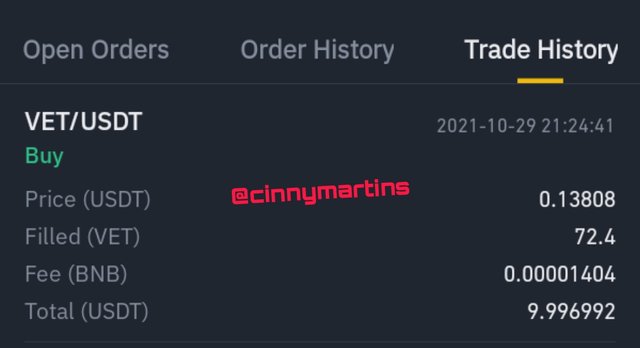
Right here I have the full details of my transaction executed on my Exchange and that is all for this task.
CONCLUSION
it was more than a study, it was an adventure getting to know that we have a unique Indicator that numbers its candle. An indicator which guide traders to trade profitably. I grabbed a lot from this concept.
Cc.
@reddileep
Hello @cinnymartins,
Thank you for participating in Steemit Crypto Academy season 4 week 8.
You have defined TD Sequential Indicator in your own words
Always include the source of every screenshot except your own illustrations.
In the 3rd question, you've tried to explain the TD Setup during a bullish and a bearish market. Try to organize your chart analysis in the correct order.
In the 4th question, your charts are a bit unclear. I think this is because you take screenshots from your mobile device. So, try to use a Laptop or desctop. Then you can make a creative presentation.
In the 5th question, you were failed to demonstrate all the requiremenets. I didn't highlight anything in the charts. You didn't sell that coin before the next resistance line as I mentioned in the assignment.
Furthermore, I noticed that you've withdrawn all the rewards without powering ups. Steemit will not grow this way. So try to power up at least half of your rewards. Then you can earn more additional rewards too.
As a summary, you have tried to explain all the topics in your effort. Some of your explanations were a bit shallow. Specially, you have to improve the quality of your presentation using markdown styles. I invite you to avoid all these mistakes in the next class.
Downvoting a post can decrease pending rewards and make it less visible. Common reasons:
Submit