Greetings to my crypto mates and everyone viewing this. This is another interesting homework given by our prof
@allbert. It's a bit tasking, however, his explanation is of top-notch. Please, move with me as I pour down what I understood in the lectures
Before showing the graphical representation of the weak and strong levels, let me shortly explain what I understand.
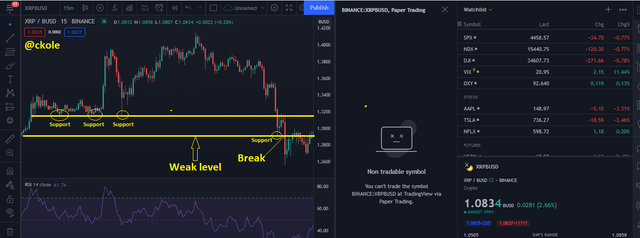
The weak and strong levels has to do with support and resistance. How firm does the price level reverse and at what point? Does it fluctuate without respecting a certain level or has a base or roof where it tends to reverse
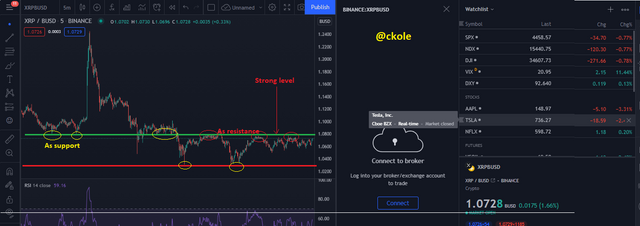
strong level (either support or resistance) occurs when the price of an asset reverse at a particular point over a period of time. For example, if the price of say Bitcoin start moving up from $30k, and it keeps reversing without breaking through the 30k mark but touches it multiple times, and goes back up, we can consider that scenario to be a strong support level and vice versa. Sometimes, when strong support or resistance occurs, and the price eventually breaks through, the price might still respect that same point. Let's see the image below
All circles in yellow serves as the support level, while the red circles signify the resistance level, and as we can see from the image, the red line points to the strong level
Just as the name implies (Weak), it means there is no ability to retain a particular level. There is easy displacement. the support and resistance level here is not reliable because the price easily breaks through without respecting the levels most times. When this is discovered in the market, we can say the level is weak
For the weak and strong level to occur in the market, there would need to be pending buy/sell order of which should occur in a lower volume and small quantity. When there are pending orders in the market, and the market is liquid enough, reversal is imminent depending on the quantity and volume of either the sell or buy order
If there is a support level, it means there is a pending buy order, and if it's the resistance level, the pending sell order is at work. Whenever these orders fill and got exhausted, that is when we see a break. It's just like two people selling apple on a spot. People will patronize both of them and they would both keep selling, but once one person's apple finishes, only one person would be patronized, which means if they are both striking balance, the equilibrium would be broken because only one person would be patronized. It's only when the second person refills her tray (more pending order created) with apple that the balancing would start coming back
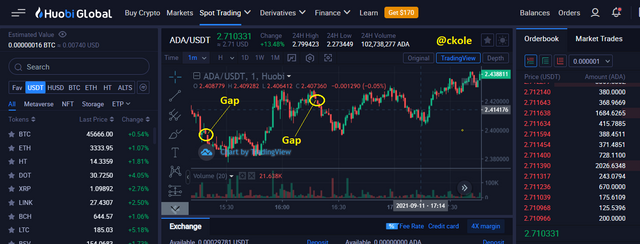
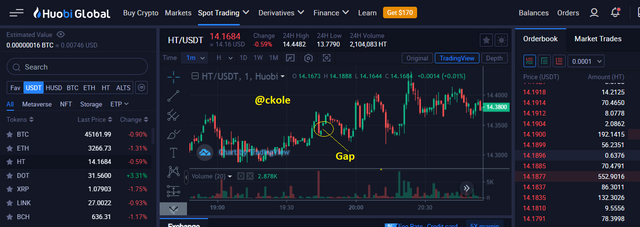
Gap means space. So using the word in a crypto context means space between prices in an unusual way. When the price of an asset jumps like a cheata, breaking the normal protocols, we can say there is a jump in price and that is referred to as Gap. Let's see the image below
.png)
From the above image, it's clear that the closing of the candle where the gap occurs does not correspond with the new opening of the other candle. This means they are not on the same level as other candles seems to be
We should understand that a gap can occur when no trade took place between one moment to the other (Always a very short period). And also as a result of a sudden market movement that has to do with high volume.
Question 3
Explain the types of Gap (Screenshots required, it is not allowed to use the same images of the class
Exhaustion gap
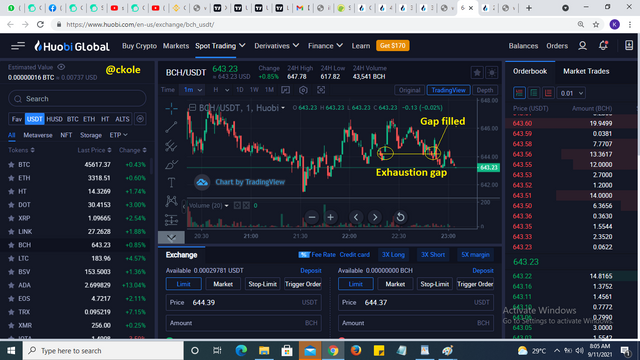
This type of gap is not easy to spot. In fact, it can be taken for another type of gap. The only way we can finally identify this gap is when there's a reversal to fill the space. As we can see from the image below, when the gap occurred, it seems as if it was running away, but retrenched at a point to cover the spot it left blank. If we can identify the exhaustion gap before the retest takes place, we would be able to use the support and resistance level to place a trade since we already know that the price would come back to fill the space
Run away gap
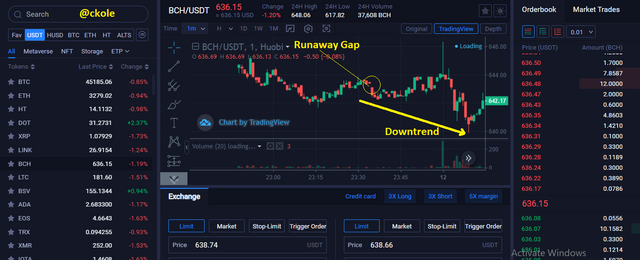
This happens when the price of an asset is about to start moving. I.e, when the trend is still in its infancy. The runaway gap indicates that the trend would still continue moving towards that direction it took from the start, so we can say it's a continuation of the current trend
The runaway gap can act as a good support and resistance point if rightly spot, because when the price moves back to the point where the gap was created, there is a possibility of it respecting that point, thereby forming a strong resistance or support level
Breakaway gap
.png)
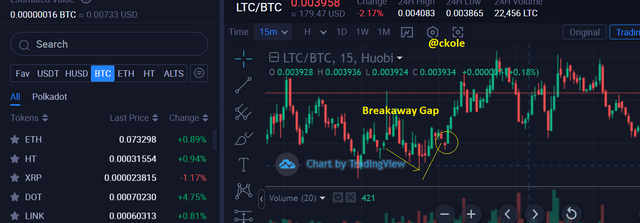
Breakaway gap is very cogent among the gaps we have. It's just like going off to create a new trend. When this gap happens, there's likely to be a new trend different from the existing one. The sweetest part of recognizing the breakaway gap is that it can be used to determine new support and resistance level and they are always strong ones, so since the gap represents the beginning of a new trend in most cases, the support and resistance level can be utilized reasonably
Question 4
Through a Demo account, perform the (buy/sell) through Strong Supports and resistances. Explain the procedure (Required Screenshots)
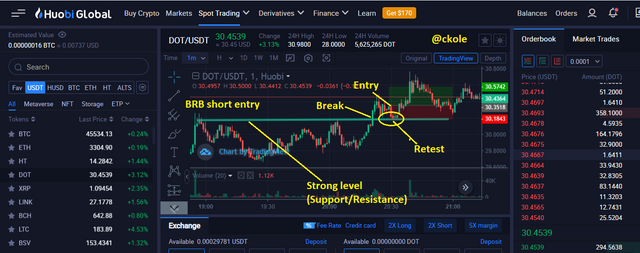
From the image, the BRB strategy was used to enter the trade. The first thing I did was that I noticed the strong level, and when I discovered there was a break I waited for the price of the asset to retest and bounced back when it reaches the resistance level. The trade was placed after the reversal and my stop loss and take profit level was set. I only made a short entry.
Question 5
Through a Demo account, perform the (buy/sell) through Gaps levels. Explain the procedure (Required Screenshots).
.png)
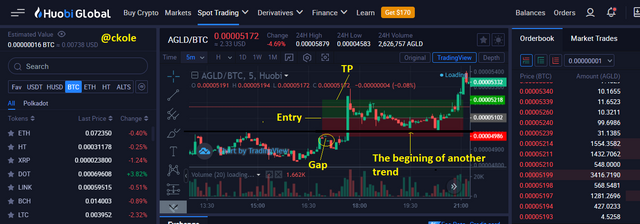
When the gap occurred, I waited to see which type of gap the market was trying to produce, and when I discovered there was a reversal and the price closed the gap on its way up, I waited for it to break the strong level before going with the trend by placing a buy order and setting my stop loss and take profit at ratio 1:1.
Conclusion
The strong and weak levels are very powerful if we can follow them the right way. It shows us when to enter the market and when to exit. One thing we need in trading is knowing the right time to buy and sell, and I think that's the basis of trading, which is all about making profit.
The gap is also a good part that should not be ignored because it can be used as or to spot strong support and resistance level.
Thank you for going through my homework.
This is ckole the laughing gas
One love
CC: @allbert (The prof)

.png)


.png)

.png)