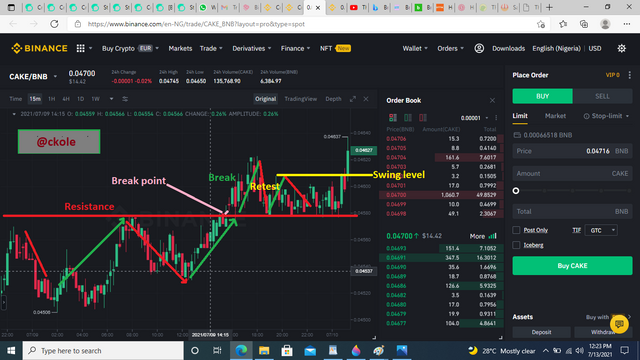
The important levels to trade BRB in a buy scenario

Question 3
Explain Trade Entry and Exit Criteria for both Buy and Sell Positions on any Crypto Asset using any time frame of your choice (Screenshots Needed)
It's important to understand the kind of market condition where a break and retest strategy functions. And also, it's paramount to know the rules and how the market condition function before knowing how to place a trade and exit at the right time
I prefer using a three-wave price structure to enter or exit a trade if only I'm using the BRB concept. Why I mostly wait for this signal is because we traders use multiple tools to identify an entry and exit point, but in a case where we decide to go one way without confirming with another strategy or indicator, we need to be extra careful and patient to do the right thing, because the market always act as if it's friendly, but when you delve into it, you might see the other side of it
The first rule is to identify a trend. We must have a glimpse of the fact that a market is going either boolish or bearish
Secondly, we should be able to draw the areas of support and resistance
Be patient to see the pullback and retest level before making a decision
And finally look for an entry point with regards to the direction of the trend
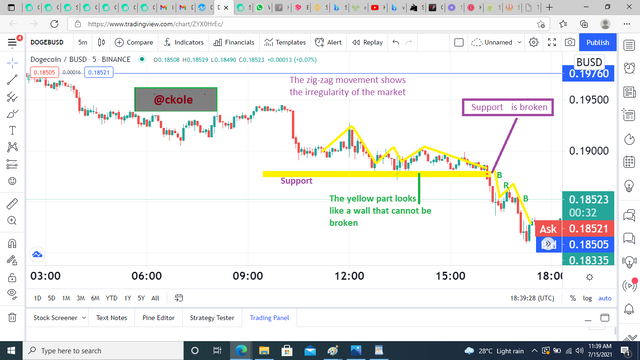
I will answer this question based on these four points on the graph I'm showing below.
First and foremost, I identified the graph as a bearish pattern trend because the direction of the movement already signifies a bearish movement, however, that is not enough. I still need to initiate the second step. However, From the image I'm analyzing, when the price of the asset broke the resistance level, It's an indication that the bears are taking the lead
The second step I followed was to draw the resistance point to ascertain whether my analysis is correct or on-point whatsoever
After that, I had to closely check out for pullback (broke) and retest level
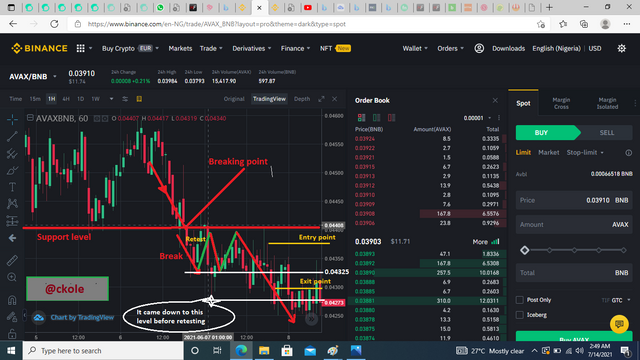
The entry and exit point criteria using 1h time frame in a bearish trend
I noticed the support level and watched closely. When the price of AVAX broke the support level, I waited to see a retest. From the image, the support level was broken at 0.04408, and retest at 0.04325 (The white line shows the point). The second break went further down to 0.04260, and retest again. But the good thing is that retest didn't exceed the first level where the break started from the support level. This was when I was assured to get an entry point between 0.04400, and 0.04350, and put my exit point somewhere around 0.4300
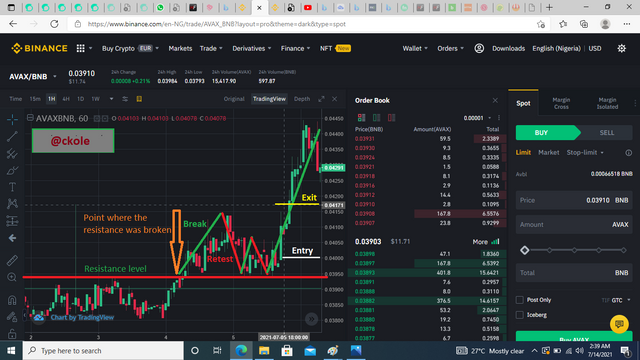

Question 4
Place 2 demo trades on crypto assets using BRB Strategy. You can use a lower timeframe for these demo trades
%20last%20question.png)
I used 1-minute time frame to monitor the price action and placed a buy when I saw the green light. It was a short movement I used to place my trade because it seems difficult to quickly act using the BRB with one minute time frame but I was fast to use the strategy because I don't want to miss the opportunity. I set my stop loss at 1.8055, and take profit at 1.18076 and I entered the trade at 1.18062 (which is the yellow line I drew) when the long break (green candlestick) broke well beyond the resistance level after the first break. If I wasn't conversant with the BRB, I would have missed the point to put my stop loss. As we can see in the image, My top loss was placed a little below my resistance and after I took my profit, the next break went past my stop loss. Everything happened so fast because it was a 1-minute time frame. If I hadn't acted fast, it would have been another story. Below is the proof of the trade I made and the profit
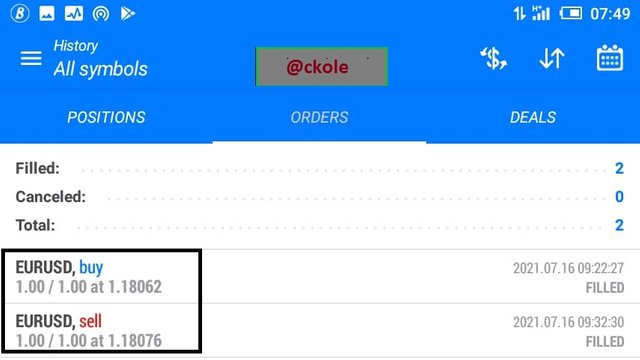
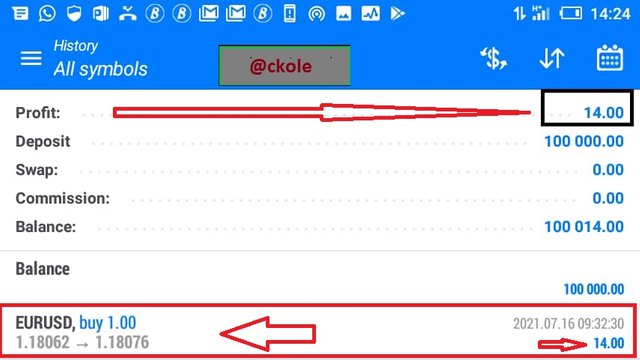
Conclusion
The BRB strategy is a unique strategy that can work wonders if properly monitored. It cut across the main things that determine the price movement of an asset, talking about resistance and support (mainly). The only thing needed in the BRB strategy is to create time to watch the movement of the candlesticks, and when the BRB lines come into play, action should be taken immediately and we should be conversant of the time to exit as well. All thanks to
@cryptocraze for his wonderful lectures. I enjoyed the BRB strategy. At least, I can trade with it if I don't feel like using any indicators
Bravo!
Thanks for reading.
This is ckole the laughing gas. One love
Cc: @cryptocraze

%20swing%20res.png)

%20bbbb.png)


%20last%20question.png)


Dear @ckole
Thank you for participating in Steemit Crypto Academy Season 03 and making efforts to complete the homework task. You got 6.5/10 Grade Points according to the following Scale;
Key Notes:
We appreciate your efforts in Crypto academy and look forward for your next homework tasks.
Regards
@cryptokraze
Downvoting a post can decrease pending rewards and make it less visible. Common reasons:
Submit
Your review is very right prof. I already marked myself before your review. I gave myself between 6-7 scores. I know my weak point, so I'm grateful for the wonderful and truthful comment. Looking forward to the next assignment. One love
Downvoting a post can decrease pending rewards and make it less visible. Common reasons:
Submit