All these can be identified using the kumo cloud. I will show some images to explain all these below
.png)
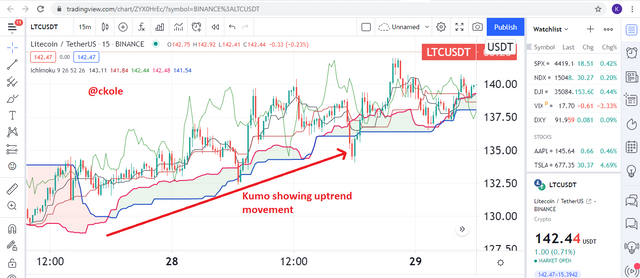
As we can see from the above image, that the chart shows an uptrend movement of an asset, and looking at the Kumo cloud, it goes in the same direction upward. That is when we can notice the movement of price with the cloud. When the price of an asset goes up, the Kumo travels with the trend and we see the bullish movement
.png)
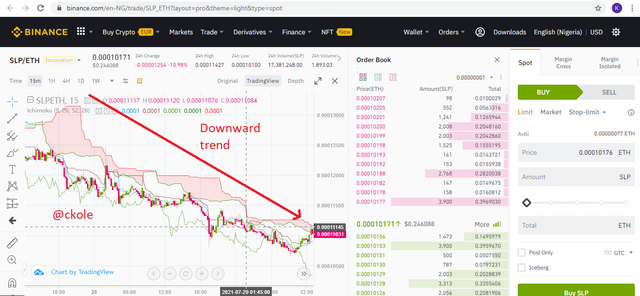
The opposite of what happens in a bullish trend is what we would see in a bearish trend. Looking at the Ichimoku cloud, we can easily tell that the price of the asset is decelerating. When the price comes down, the Kumo travels in the same direction and we can easily notice the downward movement at a glance
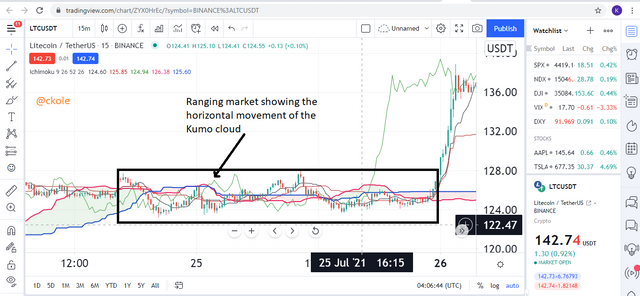
The ranging market is always in-between. It would neither travel up nor down. When you see the Ichimoku cloud traveling as the bird crow, it means there is a ranging market where the bears and the bulls have not yet decided whether buy or sell massively. This is called the competition stage. The Kumo would maintain its horizontal movement until there is a bullish or bearish movement
.png)
The Kumo has only two lines and they are
Chikou span A
Chikou span B
These are the two lines that made up the Kumo cloud. Both lines complement each other because there cannot exist the Kumo cloud without any of the two
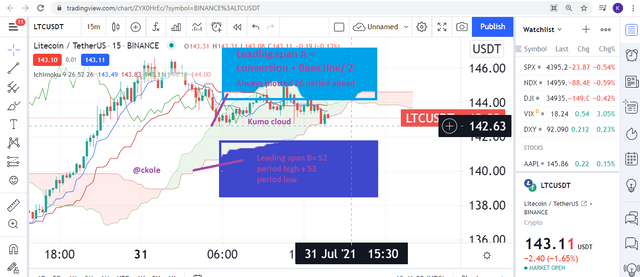
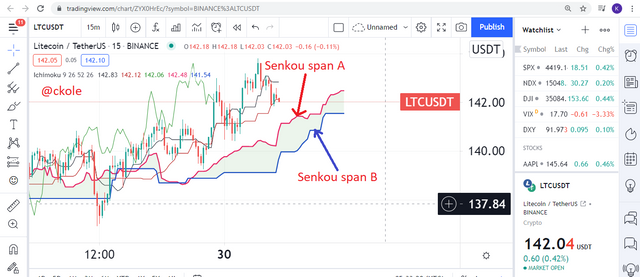
The senkou span A forms the top of the cloud.
Senkou span A is calculated by taking the average of Tenkan Sen and the Kijun Sen 26 periods ahead. This means that the addition of Tenkan Sen and the Kijun Sen, divided by 2 equals Senkou span A.
taken from my first homework on Ichimoku kinko hyo
The Senkou span B forms the lower part of the Kumo cloud and it's calculated by taking the average of the highest high and the lowest low 26 periods further for the past 52 periods. This line plays a lot of roles as it gangs with the SSA and shows the current trend changes reflected by the future cloud.
.png)
.png)

Question 2
What is the relationship between this cloud and the price movement? And how do you determine resistance and support levels using Kumo? (Screenshot required)
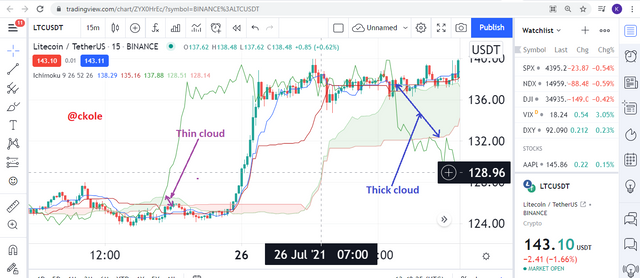
The first relationship I would mention concerning price movement is the thickness of the cloud. If we notice most graphs where the Ichimoku indicator is enabled, we would see that the Kumo cloud is never of the same width. Sometimes, it looks thin and another time, we see it as big as the moon. This is because the price of the asset behaves in different ways, going up and down. Where the cloud has the relation with the price movement is where the wide and thin cloud sets in. It shows an obvious signal of how the price moves
The wide cloud shows that the price may not go farther than the lines that make up the cloud so it's imperative to be careful while transacting at this level because the price is weakening here and might take a little time to see a breakout from the cloud, either way,
The future Kumo cloud has a lot to do with the price action as well. We have the current Kumo cloud and the future Kumo cloud. Everything going on in the current Kumo cloud is forming the future Kumo, so to a reasonable extent, the current price action dictates what is gonna happen in the future
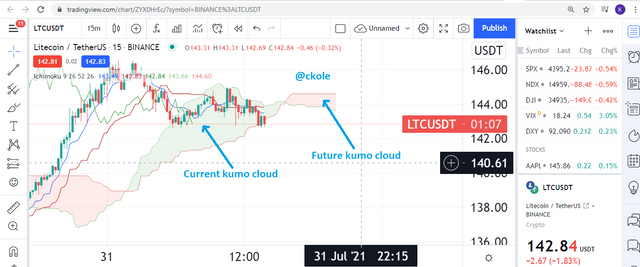
The future cloud is the current calculation of the Senkou span A which is taking the current tekan sen and the Kijun sen average 26 periods into the future. And the other line (Span B) which is the price action for the last 52 periods plus the lowest low of the same period, both make up the future cloud
We need to understand some other concepts of the Ichimoku cloud.
Price above the cloud
Price below the cloud
Price inside the cloud
When the price of an asset is above the cloud, a bullish trend would occur. When the price is below, we see a bearish movement, and lastly, when the price moves in the cloud, that's consolidation. So that tells us the three basic market sentiments the cloud can show us looking at the price in relation to Kumo cloud
The color of the Kumo cloud can also tell what is happening in the market. Whenever the senkou span A line is below Sekou A line, the cloud turns red, which indicate that the price of an asset is dripping down, ie going bearish, but when the senkou A line remains above the other line (Senkou B), we get the glimpse that the market is bullish and the Kumo cloud turns dark grey. This only shows us the direction the market is moving
The Kumo cloud support and resistance
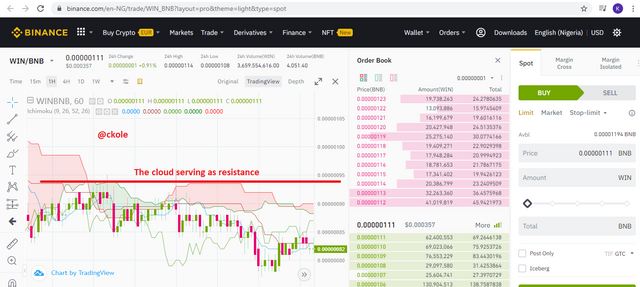
Normally, we look for the support and resistance level of an asset by merely looking at the level where the price reverses continuously at a point and draw a straight line that helps us know the right time to enter or exit the market. This traditional way is different from how these levels are determined with the Kumo cloud. As we've discussed that we have two lines that make up the Kumo, these lines are the main part that serves as the support and resistance of the Kumo. When the candlestick moves close to either the senkou lines, it bounces back. See the graphs below
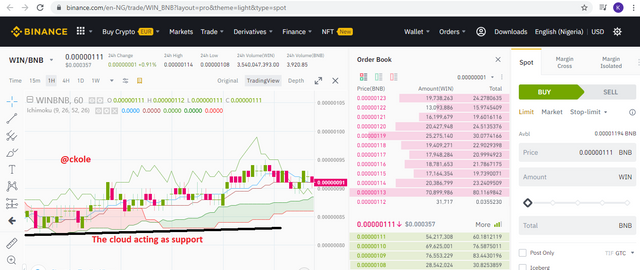
Kumo cloud support level
Kumu cloud resistance level
F
rom the above images, we can see that there is a reversal on both resistance and support level from the graphs. It's either the price bounce back at the span or the span b lines either way (upward or downward depending on the trend)

Question 3
How and why is the twist formed? And once we've "seen" the twist, how do we use it in our trading? (Screenshot required)
In most cases, twist happens 30 periods ahead of the time, and this is the point where the cloud tells you that things are changing. You would see that the signals are aligning with the Kumo twist, as the price weakens, which gradually breed another new trend
So how is the twist formed?
- The twist is formed when the two lines that form the cloud crosses
Why is the twist formed?
- The reason the twist is formed is because of the change in price action
Let's see a brief explanation.
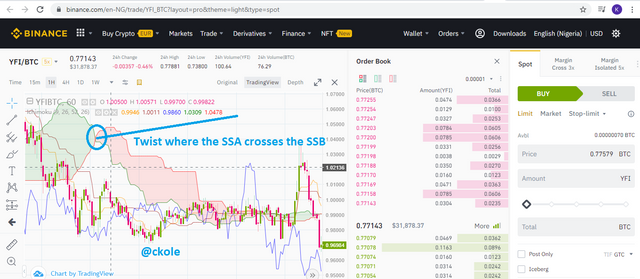
When senkou A and Senkou B crosses, that is the point of twist. And as the case may be, we can have a twist in an uptrend direction, or a downtrend movement
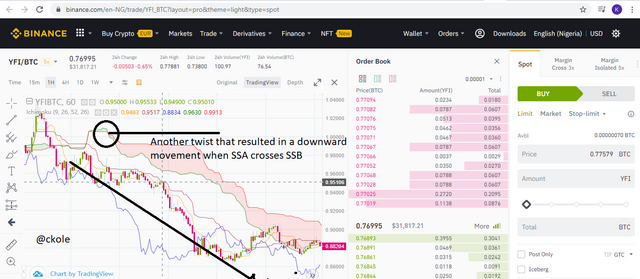
In fact, the twist can serve as a reversal on whether in a bullish or bearish trend and at the same time deceive us and enter the ranging level or act as a correction for the initial trend. So sometimes, we can have an invalid Kumo breakout seeing a twist. Because it's not advisable to totally (100%) rely on the trend movement
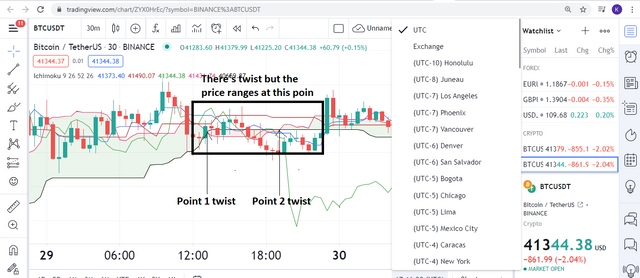
A situation where the twist deceives a trader. If as a trader you follow the trend without other confirmation, it's possible to enter wrongly. We can as well get other confirmation that would make us at least certain that the twist will go in a particular direction.
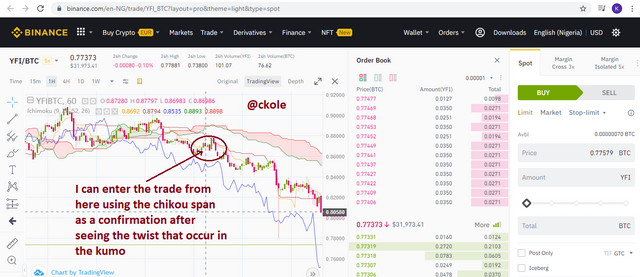
When the price of an asset enters the Kumo and it changes its movement, it's not enough to conclude, rather, we can wait to see if it would break the Kumo cloud. Also, the Chikou span is a very good line we can use to follow up with the Kumo cloud looking at the twist. While there is a twist, we should be aware of the fact that the chikou line has broken the Kumo, and it's either under or above it depending on the price trend
And finally, the Sekou span B should be noticed closely because the direction of this line lag a lot, so when we notice the direction of its movement with the trend, we can confirm that the market is moving towards a specific direction

Question 4
What is the Ichimoku trend confirmation strategy with the cloud (Kumo)? And what are the signals that detect a trend reversal? (Screenshot required)
The trend confirmation strategy with the Kumo cloud as far as I understand is the way the lines that make up the Kumo behave on different levels and occasions. We know that the Kumo cloud lines (senkou A and B) play an important role in the price movement/trend of an asset in various ways. So I can say that the Ichimoku confirmation with the Kumo are
When there is a twist, as explained earlier, it is a confirmation that the price of an asset might go up or down as the case may be.
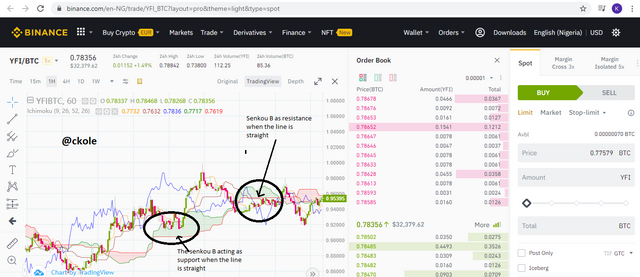
When the senkou B line remains flat for a period of time, we can determine that the price action also because it's the line that determines the price action for 52 periods, so we can deduce that the low or the higher value for this period will not exceed the flat part of the senkou B until there's a further change in the horizontal line.
We can also say that these lines play a good role in support and resistance at this period. In fact, it seems to be more powerful within the period it occurs.

Question 5
Explain the trading strategy using the cloud and the chikou span together. (Screenshot required)
As we've discussed earlier that the Kumo cloud can be effective in showing the market trend, and also deceives sometimes even after a twist occurs. to get another sweet confirmation, the chikou line can be used to enhance the trading strategy with the cloud
And how can this enhance our strategy
When the chikou line finds its way below the Kumo, and the price action also moves below the Kumo as well, it's an indication or confirmation that the downward trend would continue if there is a twist. Also if the chikou line finds its way above the Kumo cloud and the price action moves above the cloud, it's also a confirmation of a bullish trend. Let's take a look at the image below for a practical purpose
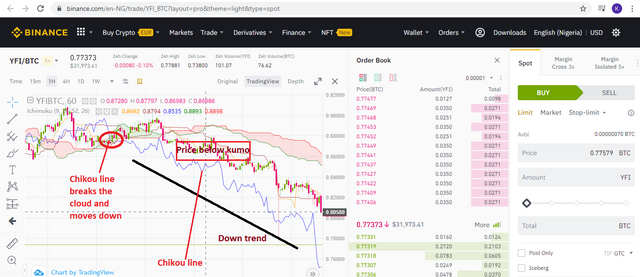
From the image, the chikou span crosses the cloud and moved in the direction of the trend leaving both the candlesticks and the Kumo cloud above its level. The price remains between the Kumo and the chikou span, and the cloud itself stays at the top leaving others below
So in this wise, if I want to enter a trade, I will have to consider the chikou span to enhance my strategy. As we know that the cloud can show us the trend to follow, the chikou span can serve as a good confirmation of the direction of the trend

<center<Question 6
Explain the use of the Ichimoku indicator for the scalping trading strategy. (Screenshot required)
First, we need to understand what scalping trading is before we can use the Ichimoku indicator to trade it. So what is a scalping on its own?
Scalping can be said to be a high-frequency day trading where the aim and objectives of the trader are to make little gain incrementally, which adds up to a large profit with time. It involves holding a trade for few minutes or even seconds, and this makes it the fastest form of trading we have. As a scalper, any opportunity that works in their favor is a plus. If the price moves in their favor, they take the profit and get set for another promising entry. Also, a scalper happens to be the best trader that knows how to minimize losses, by closing the trade earlier before it chops up its funds.
So, I can say scalping is a very intense form of trading that requires 100% attention
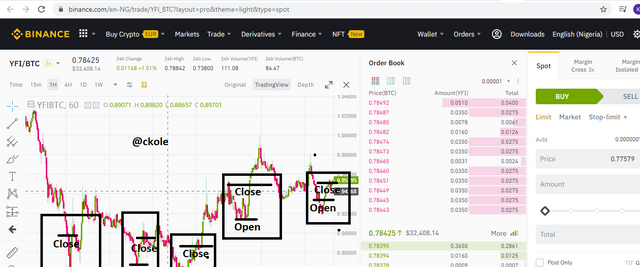
From the above image, we can see that many trades were open and closed at every possible opportunity discovered especially with the trend. Let's see how the Ichimoku can be used as an indicator for scalping
To use the Ichimoku indicator for scalping trading, we must understand that we should trade with the trend because it makes it easy to enter and exit the market as fast as possible as it helps to reduce speculations
So let's see how the Ichimoku is used briefly for scalping
As usual, the Ichimoku indicator has 5 lines, but if I want to use this indicator for scalping, I will respect three lines namely
Chikou span
Senkou span A
Senkou span B
Both Senkou A and B would be regarded as one which is the Kumo cloud.
Now, as I've been explaining from the beginning of this work, we would reverse to complete this. The Chikou span and the cloud would be used for my scalping in the sense that, when I notice that the cloud is separated from the candlesticks whether above or below and the Chikou span also stays below or above the price movement, it means there is a trend on point either bullish or bearish. Looking at these lines closely, I can start entering and exiting along with the trend sharply with a high level of attention without wasting time simply because I want to accumulate profit little by little
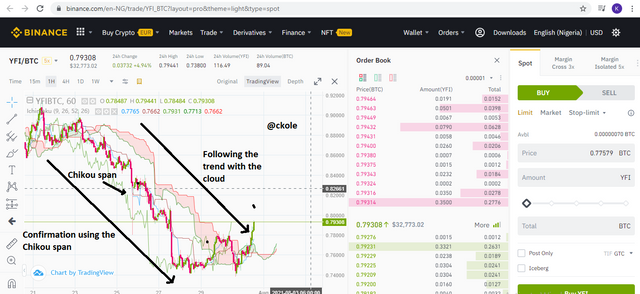
So while using the Ichimoku for scalping, there is no time to wait for some information before entering and exiting the market. Once we can use both lines to identify the trend, we can trade with the trend and watch closely as the market travels towards the obvious direction and keep scalping till we discover the trend has come to a halt trying to start another phase of trend

Conclusion
The season two of the Ichimoku seems logical and more advance than the season one because this has to do with focusing on all the market trends, whether uptrend, downtrend or ranging market. The fact that the cloud has its powerful way of spotting the support and resistance level to help traders identify the trend movements and the continuity is a powerful orientation
All in all, the Ichimoku indicator housing the five powerful lines cannot be sidelined in the prediction of market trends. Also, the Chikou span is an important part of the indicator that can be well used with the Kumo cloud for confirmation. It's a pleasure participating in this homework. Thanks for taking your wonderful time to read through my writ up. All thanks to professor
@kouba01 for squeezing his time to provide the lecture. Much love as we learn from the academy
Thank you all.
This is ckole the laughing gas. One love
CC: @kouba01


.png)
.png)
.png)
.png)
.png)


Hello @ckole,
Thank you for participating in the 5th Week Crypto Course in its third season and for your efforts to complete the suggested tasks, you deserve a 9.5/10 rating, according to the following scale:
My review :
An article with excellent content in which you provided a bunch of useful information to answer the questions asked, and I have a few additions:
How to determine the support and resistance levels that depend on the Ichimoku indicator as you mentioned is dynamic and different from the traditional way, so it was possible to focus on showing the difference.
For your information the preferred strategy of Scalping with the Ichimoku indicator is called "Scalping Ichimoku in one minute M1", but we all know that the supports and resistances identified in the higher time frames will have a greater impact on the price trends. This is why the analysis of Ichimoku M15 and M5 is essential.
Thanks again for your effort, and we look forward to reading your next work.
Sincerely,@kouba01
Downvoting a post can decrease pending rewards and make it less visible. Common reasons:
Submit
Thanks professor for the addition. It's well appreciated. Looking forward to the next lecture. One love prof.
Downvoting a post can decrease pending rewards and make it less visible. Common reasons:
Submit