.png)
Good day, all my fellow crypto gears. It's wonderful to participate in this week's homework given by our professor @kouba. It's all about the Chaikin indicator. We've received a wonderful lecture from the prof and this is the homework we were given. Please stay with me as I present mine.


CMF relates volume to the price action of an asset
Measures money flow volume (20 or 21 days range)
Buying pressure is evident when the price is above zero
Selling pressure is evident when the price is below zero
Money flow multiplier (MFM): This is the longest of all the calculations
Money flow volume (MFV)
Sum of MFV/Sum of volume (over 20 or 21 periods)
Indicator must fall between +1 and -1
The money flow multiplier formula

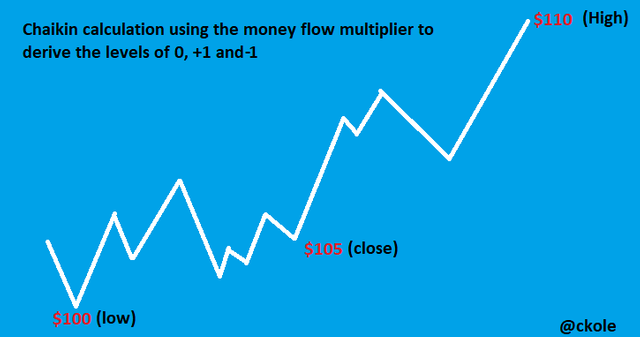
The image above shows the low, close price, and the high for a 20 or 21 days period. So to calculate the CMF value, we use the money flow formula. I will be using this to derive the main level of accumulation (+1), distribution (-1), and the midpoint (0).
Using the MFM formula, with respect to the image, where close = $105, low = $100, and high = $110, let's substitute the values in to the formula
So from these calculations, we can say the Chaikin money flow is zero, which is an important benchmark in using the Chaikin indicator, and it's seen as the halfway point meaning the current closing price is in between the low and the high.

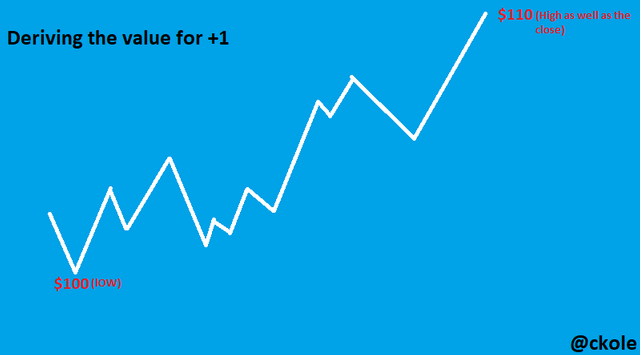
So to calculate for the +1 derivative
So this tells us the money flow multiplier is strong and at the accumulation stage.

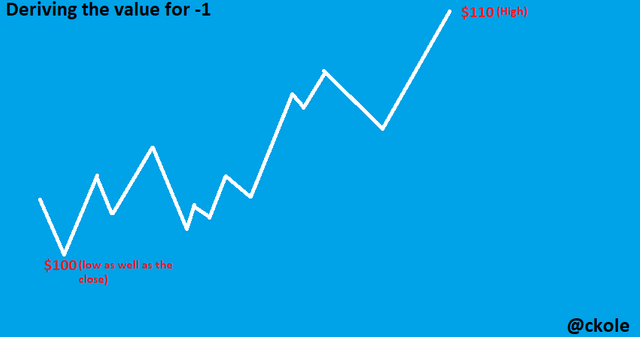
Using the same formula, let's look at the calculation for -1
So this implies that the price is at the low (the distribution stage)
All the examples were to show the exact calculation of the multiplier. Now, let's look at a calculation using all the formulas to calculate the Chaikin money flow value using a 20 days period to get the 21 period
.png)
.png)
This is an image from the coin market cap showing the price of XRP in the past 20 periods counting from 13th October to 24th September to get the result for 14th October. So I'm using the parameters for the past 20 periods, I would need to calculate it one after the other starting from 13th October to 24th September.
Substituting the values into the formula
cash flow multiplier for 13th oct 2021 = 0.6666
12th October 2021
cash flow multiplier = - 0.142857
11th October 2021
cash flow multiplier = - 0.14285
10th October 2021
cash flow multiplier = - 0. 8
9th October 2021
8th October 2021
cash flow multiplier = - 1
7th October 2021
cash flow multiplier = 0
6th October 2021
cash flow multiplier = - 0.06
5th October 2021
cash flow multiplier = 1
4th October 2021
cash flow multiplier = 0.02
3rd October 2021
cash flow multiplier = 0.14285
2nd October 2021
cash flow multiplier = 0
1st October 2021
cash flow multiplier = 0.6509
30th september 2021
cash flow multiplier = 0.4417
29th september 2021
cash flow multiplier = - 0.2109
28th september 2021
cash flow multiplier = - 0.952
27th september 2021
cash flow multiplier =- 0.9139
26th september 2021
cash flow multiplier = 0.6122
25th september 2021
cash flow multiplier = 0.235
24th september 2021
cash flow multiplier = - 0.00557
From all the calculations above, I was able to get the value for MFV using this formula
MFV = MFM X VOLUME. (I did this for each period) and the value after doing the sumation is
MFV = 935,077,628.831679
The sum of the volume for 20 periods = 3,488,392,373.391679
chaikin Money flow volume = 0.268 to 3sf
From chaikin value, this point lies in between the +1 and 0 because the value is positive. We can say at this point that the signal is strong because it's the accumulation period when buyers are buying more instrument. So,a trader can decide to also buy at this point.


Using the Houbi platform to demonstrate how to add the indicator to a chart, the first thing to do is to access the Houbi platform and log in. From there, we can choose any pair we want to trade and access the chart. Lets's see the image below.
.png)
From this image, click on the index icon and type CHAIKIN in the search option, then click on the CHAIKING MONEY FLOW. something like this would appear
.png)
The default settings is 20 period, but if we feel like adjusting to 21 or any other period that suits our preference, we can do that via the settings as shown below and we can also adjust the color , lines and so on as we wish.
.png)
.png)
As I mentioned, the default settings is either 20 or 21, but on most platforms it's set at 20. So if you ask me what period would be the best, I would say it depends on the type of trader you are. Some prefer to set it higher than 20/21 or even lower, but
The fact is that the sensitivity of the oscilation increases the more the settings reduces from it's default settings
And at a higher settings, it decreases
So in this wise, if we want to adjust the default settings, we should understand the concept, otherwise, we would receive false signals.


The indicator helps us to determine the upward and downward movement of the price of an asset in the market. The accumulation period is when the buyers are making much move to acquire more asset, and the distribution period means traders are selling off their holdings. Let's see some of these in some charts below
.png)
As seen in the image, when the CMF goes beyond the zero line, there was a bullish movement of price which signifies accumulation in the market (traders are buying and the price is shooting high)
.png)
From this image, the CMF oscillated across the mid line in a downward movement and as such, the trend continues coming down which mean the bears are in control. they are selling so at this point, the market is in its distribution state.
.png)
The negative value as we know denotes bearish movement. As the oscillator crosses the zero line downward, we see that the market move towards the down side, and the point where the oscillator crossed the zero line is a good placement for an entry, and when it starts moving up towards the line after a reasonable downward trade, we can exit the market, because as we can see in the chart, the price went up immediately it touches the zero line (bullish), so it's good to pay attention and take profit before the reversal hits us.
.png)
From the image, we can place a buy order when the the zero line is crossed upward. This is when ae can affirm that the buyers are active, and trying to accumulate. It's an opportunity to enter the market and be vigilant to take profit as at when due. Also, when the downward movement sets in and touches the zero line, we should exit the trade and wait for another confirmation.


.png)
Using the cross over signal, the trade was entered when the CMF line crosses the +0.2 level going up. The stop loss was placed below the entry point, which also serves as the support level and when the market drips down and cross the - 0.2 level, profit was taken
.png)
In this chart, we would see that the trend doesn't respect the price movement. It happens like that, and we shouldn't be carried away. When such thing happens, we should understand that the market is very solvent, meaning there's is large sum of money injected into the market that can make the market behave otherwise. So in this case, I entered the market when I discovered the line moved above +0.1 and the price is moving downward, and I took my profit when the line croses the -0.1 level. Sometimes, if the movement of the line goes against the price action, we can use the cross over strategy to make some dosh out of the market.


Trading with divergence between the CMF and trend line is something interesting. When the direction or movement of the price of an asset does not match with the CMF oscillator lines and it's direction of flow, then we can say a divergence has occur and this can be used to advantage because there is a possible reversal at this point. Let's see the bullish and bearish divergence.
In a bullish divergence, the direction of price movement goes down and the CMF faces up. they both travel in an opposite direction, so in this case, there is a probability of reversal for market correction. Let's see the image below.
.png)
From the image, we can see that the the security price was making a movement contradicting the CMF direction. The price keeps coming down while the indicator line faces up. And when stuff like this occurs most times, we should look out for reversal and that's what happened in the above image.
This indicates low buying pressure or weakness, which means the bears can take over the market anytime soon. When the indicator faces down and the price of the instrument is in an upward movement, bearish divergence is in play and it's a good sell signal.
.png)
So from the image, we can see that there was a low buying pressure as the indicator keeps going down, which cause the market to reverse and go bearish.
Of course it does. Just like every other indicators, the chaikin indicator also give false signals. It's said that every technical analysis tools is bound to fake traders. They are not solely perfect, so it's advisable to use them with other indicators. The CMF can be used with other indicator like the stochastic RSI to double check the price movement of an instrument. Two good head are better than one they say. When these indicators compliment each other, there's a likelihood of getting a more reliable signal than using only the CMF indicator.
.png)
From the above image, I used the stoch RSI with the indicator and this is what I derived.
The stoch RSI gave me an indication that the market is in an over sold level because the line is almost close to 100. And after some time, the CMF indicator line crossed the zero level downward and there was a bearish movement in price. This happens to be a double confirmation. One indicator complements another to give birth to a correct signal. That's why it's important to use other indicators with the CMF indicator.


Mark chaikin has done a great job in coming up with the CMF indicator. We can calculate the money flow in the market and get whether the market is accumulating or distributing. Also, the divergence can be used to spot possible reversal of the asset price. With all being said, we shouldn't forget to use other indicators with the CMF to get the best result.
Thanks to professor @kouba01 for providing us with this wonderful lectures, and thanks for reading.
This is ckole the laughing gas
One love
CC : @kouba01
Ref: All images are taken from houbi exchange, and others were designed by me.
Hello @ckole,
Thank you for participating in the 6th Week Crypto Course in its 4th season and for your efforts to complete the suggested tasks, you deserve a Total|9/10 rating, according to the following scale:
My review :
An excellent article in which you were able to answer most of the questions ably, and you have some notes that I made.
Thanks again for your effort, and we look forward to reading your next work.
Sincerely,@kouba01
Downvoting a post can decrease pending rewards and make it less visible. Common reasons:
Submit
Thanks, prof. I would appreciate if you can just tell me the best settings as I've pulled my stunt in doing my best. I've done all things possible to get the best I can, so as my boss and teacher, please, kindly give me the OT, so I can get the full knowledge about the best settings.
The statement above was just for explanation to show how to change the settings if at all a trader doesn't want to use the default settings which is 20 on most platforms. I know that the initiator gave 21 as the default, but we can see that most platforms use 20 as theirs. I'm confused boss. Please help me out because I want to learn. Thanks prof.
Downvoting a post can decrease pending rewards and make it less visible. Common reasons:
Submit