Source
Hello there. It's @cosai99 with this week's homework post for Steemit CrytoAcademy Season 5, Dynamic Beginner Course for Week 3. It is with such pleasure that I have been allowed to engage in such an exercise to understand more about trading crypto. Today, we will be talking about one strategy that can be used in trading, combining the stochastic oscillator and the 200-period moving average line to make potential buys and sells at appropriate times in the trend. This lecture is facilitated by Prof. @lenonmc21.
Let's dive into the task🏃♂️🌫

Overview of the "Perfect Entry" Strategy📉📈✔
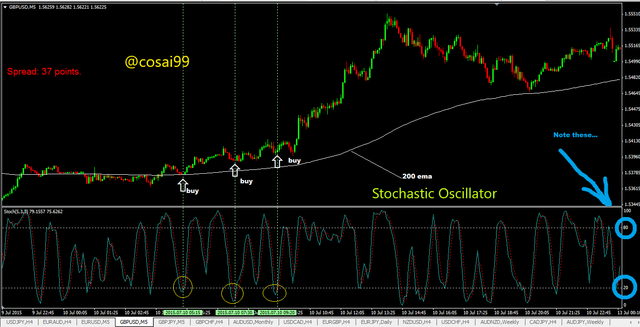
In today's world, the technological era is invading every aspect of our lives, including our businesses. Hence, the introduction to online business. Also, the same has to do with investments. We can now invest online with digital currencies called Cryptocurrencies. You can trade crypto at appropriate times and get returns on trading. But then just like how you investigate the businesses you intend to invest in and make analysis on data concerning the market growth of such businesses and its relation to the economic growth of the world, you make strategies on trading based on the trends the market experiences over a period. Investors use tools called Technical Indicators to make analyses, either one or a combination of them. This communicates the state of the market and then from that the investors make a decision. Today, we will take a look at the "Perfect Entry" trading strategy, which makes use of the combination of Stochastic oscillator and 200 moving average lines.
Source
Now, we will take a look at what this "Perfect Entry" is all about.

Theory
State in your own words what you understand about the Perfect Entry Strategy (Place at least 2 examples on crypto assets)?
Before we start explaining the Perfect Entry strategy, let's take a look at what the Stochastic oscillator and moving averages are.
Stochastic Oscillator
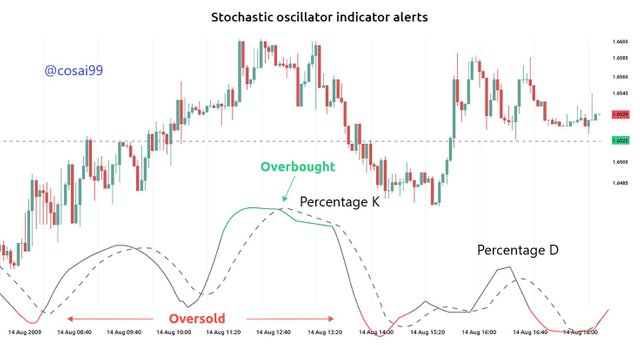
The stochastic oscillator is a type of momentum technical indicator, meaning that they monitor the changes with price in the market concerning the previously determined price. This is just like the Relative Strength Index, or the RSI, or the Rate of change of oscillation, or the ROC indicator. This monitors the changes in the price of the crypto assets at a certain period. It works in conjunction with the RSI and frequently indicates the price overbought and oversold regions. It is encompassed between values of 0 and 100. It makes use of the Percentage K value and the Percentage D value of the asset. This was developed by Dr. George Lane.
Source
The oversold region ranges from 0 to 20 and the overbought region ranges from 80 to 100. It should be noted that the crossover strategy can be utilized here to identify potential buy and sell positions on the trend. When the Percent K crosses over the Percent D at the oversold region, then we consider a potential buy in the market, and when the Percent K crosses below the Percent D line at the overbought region, we consider a potential sell position in the market. This must conform to the price trend displayed by the candlestick chart in the market.Simple Moving Averages(MVA)
These are lines that help the investors smoothen out the candlestick chart(i.e. price fluctuations in the short-term run) and determine the trend the market is following over a period. They are like trendlines of the candlestick chart. They also determine the price overbought and oversold regions of the market.

Source
Trading with moving averages has to do with either training short-term or long-term. It must be noted that investors normally like to use the 20-period MVA(short-term) with the 200-period MVA(long-term). These two together help you determine which regions are overbought and oversold to make decisions in the market. These help you make decisions in the market.
A rising moving average signifies an uptrend and a falling moving average signifies a downtrend. A bullish market(support area) is identified when the short-term moving average crosses over the long-term moving average. Conversely, the bearish market is identified when the short-term moving average crosses below the long-term moving average.
Now, we can get back to explaining the "Perfect Entry" strategy. This strategy uses the Stochastic oscillator and a 200-period moving average. These are used also used with the Japanese Candlestick, and that must come into agreement with the candlestick trend. There are 3 conditions to fulfill before executing the Perfect entry tactic.
Determining the market trend
It is very important to determine what trend the candlestick is taking. This is used in conjunction with the 200-period moving average. We look at the momentum of the price of crypto as time goes and identify the upward and downward trends of the prices.
Agreement of Candlestick with the 200 Moving Average
First and foremost, we must make sure the Candlestick follows the "flow" of the 200-period moving average to ensure an agreement. Then, we observe where and how the candlestick approaches the 200-period moving average. There will be a Trigger Candle, which will be a small candle, indicating an indecisive moment in the market where the buyers and sellers can't control the price due to pressure from both sides. It signals a moment where a reversal may be possible. It becomes a state of a standstill as the two sides exert pressure and the price seems unmoving( no rise or fall). The candlestick pattern, together with the 200-period moving average determines whether the market is in the support or resistance area. When the candlestick pattern is above and has higher highs and lows when it hits the moving average, it is identified as formed at the support area. If the pattern is formed below and has lower highs and lows, then it is believed to have formed at the resistance area.
Stochastic Oscillator
Here, you have to check the stochastic oscillator if the overbought and oversold regions conform to the conditions mentioned above. So, at the small candle, for this to coincide with all the other conditions to make the right investment decision, if the Percent K crosses over the Percent D in the overbought region, which is between 80 and 100, then you take the Market sell option. Conversely, if the percent K crosses below the percent D at the oversold region, which is between 0 and 20, then you take the Market buy option, at the small candle.
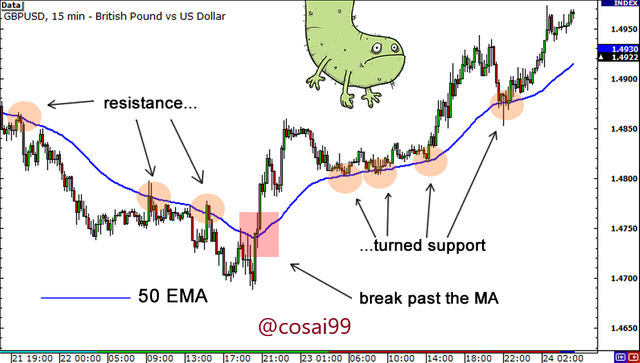
When these conditions are set, then you can make a perfect entry trade. Otherwise, if even one of them is not satisfied, then you will have to wait till they are all satisfied. The moving average may act as price support or resistance depending on its relative position to the moving average. If the candlestick pattern is formed on top of the moving average and it keeps obtaining higher highs and lows, then the moving average forms price support to the candlestick. Conversely, if the candlestick is formed below the moving average and keeps obtaining lower lows and highs, then the moving average forms a price resistance to the candlestick. This is shown below.
Source
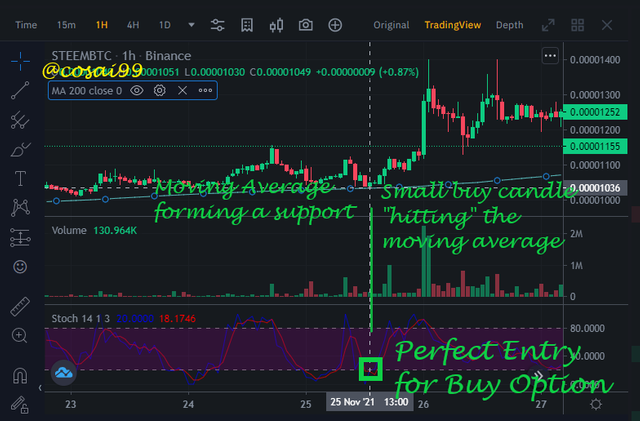
Now, to make a perfect entry for a buy, the moving average must be acting as a support to the candlestick. Then, you must check the stochastic oscillator and if at that same point the percent K crosses over the percent D at the oversold region, then you make your entry for a buy. That is the Perfect Entry for Buy
.png)
Example of Perfect Entry Buy Option
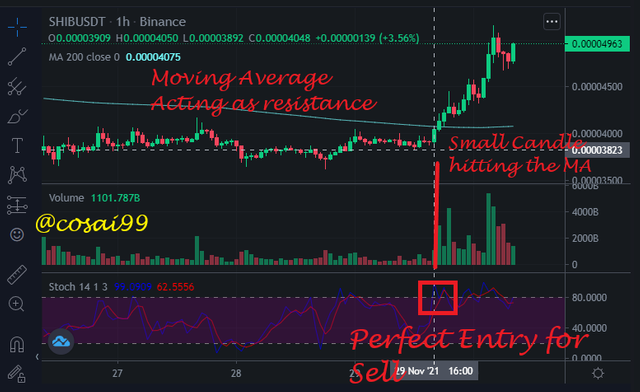
Conversely, to make a perfect entry for a sell. the moving average must act as a resistance to the candlestick. Then, you must check the stochastic oscillator and if at that same point the percent K crosses below the percent D at the overbought region, then you make your entry for a sell. That is the Perfect Entry for Sell.
.png)
Example of Perfect Entry for Sell
This is the Perfect Entry Strategy. Examples of crypto assets are given above as the STEEM/BTC trade and the SHIB/USDT trade

Explain in your own words what candlestick pattern we should expect to execute a market entry using the Perfect Entry Strategy.
As observed, the strategy is to signal possible reversals in the current trend and enables you to take the opportunity of that possibility and trade. Consequently, it is indeed consistent with a type of candlestick pattern. Now before that, it must be noted that we take the buy or sell entry option at the moment the candlestick makes contact with the moving average and also the position of the candlestick relative to the moving average, as I explained already. Hence, the candlestick patterns to expect are the Morning Star and Evening Star candlestick patterns.
The morning star is observed when you are to make a perfect entry for a buy since it connotes a trend reversal to the bullish market. The small candle which makes contact with the moving average is the indecisive point in the market, which is one of the candles in the morning star pattern.
The evening star is observed when you are to make a perfect entry for sell since it also connotes a trend reversal to the bearish market. The small candle which makes contact with the moving average indicates an indecisive point in the market, which is also one of the candles in the evening star pattern. This is also formed at the resistance area, which is consistent with the Perfect Strategy for a Sell. This is conversely true for Morning Star.

Explain the trading entry and exit criteria for buy and sell positions in any cryptocurrency of your choice (Share your own screenshots)
Trading Entry and Exit for Buy Position
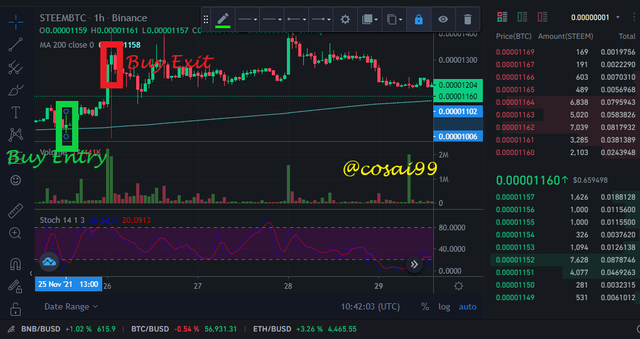
We have explained that the best time to make a buy trade is when the moving average is acting as a support to the candlestick, meaning the is a rise in the price of the asset. It is best to enter the buy trade after the small bearish candle touches the moving average. This signals the possibility of a trend reversal to the bull market. Wait for the next bull candle to form.Make sure it has a relatively high market volume. Follow the trend. You exit then trade the moment the bearish candle having a high volume forms.
.png)
Source
Trading Entry and Exit for Sell Position
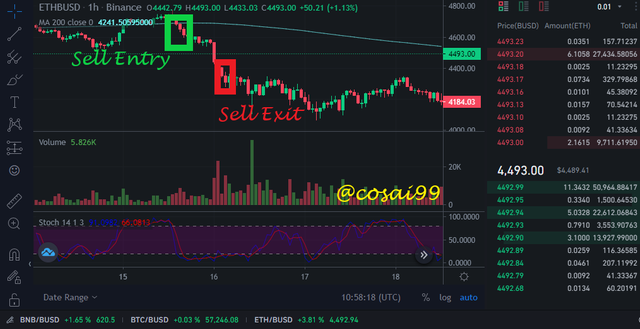
Conversely, the best time to trade is when the moving average is acting as a resistance to the candlestick, meaning the price of the crypto asset is about to decline. It is best to take a sell position after a small bullish candle touches the moving average from below, signalling a possible reversal in the current trend. Wait for the next candle to form, especially a large bearish candle, which is a bear market having a high market volume. Follow the trend and exit trade the moment a bull candle with a relative bigger volume forms.
.png)
Source

Practical
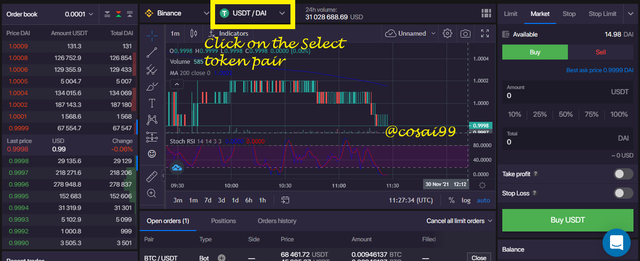
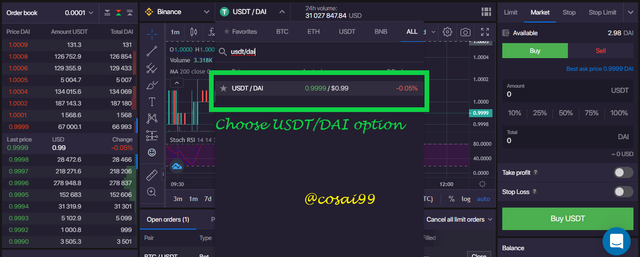
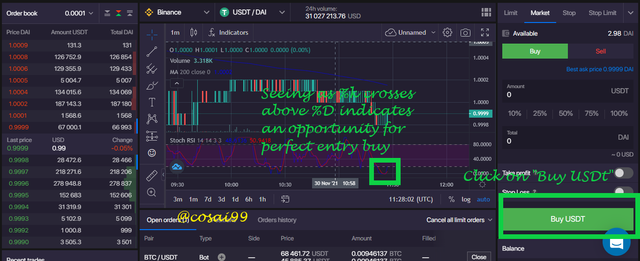
Making a Perfect Entry for a Bull Market
.png)
Source
.png)
Source
.png)
Source
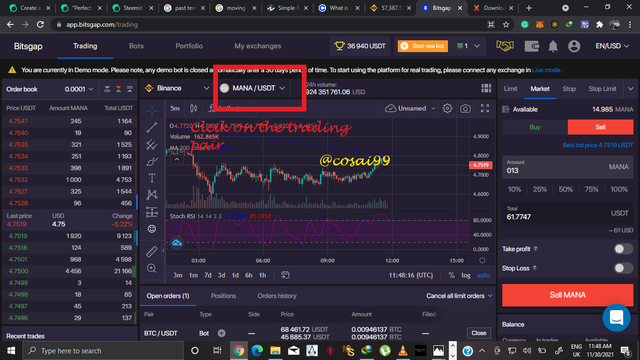
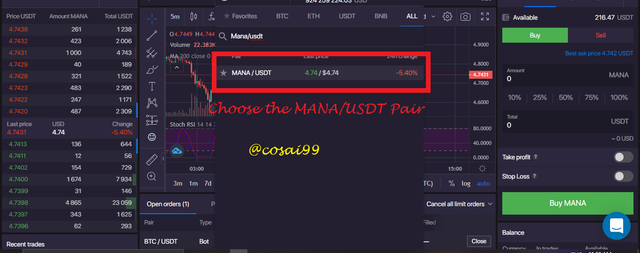
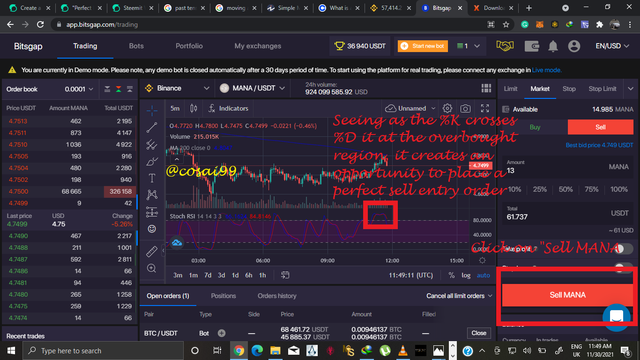
Trading a Perfect Entry with a Bear Market
.png)
Source
.png)
Source
.png)
Source
These are screenshots of making a perfect entry in a demo account. The processes are displayed in the images.
Thank you for reading, Prof. @lenonmc21🙏🙏🙏🙏🙏🙏🙏
