Source
Hello there again people👋👋👋👋👋👋👋.
It's @cosai99 again with the next homework post for CryptoAcademy Dynamic Beginners' Course, Season 5, Week 4. Previously, we learned of different patterns used to make strategies for trading and as such included triangle and flag patterns. These are used to signal the pattern of the market trend to make good decisions in the market. These also include what we will talk about today, Rectangle Patterns. This is very important we understand what these patterns are and when to use them, because misuse of them may cost you a big loss to your investment. This lecture was facilitated by Prof. @sachin08.
Let's get on with it then.

Understanding The Usage of Rectangle Pattern📊✔📓
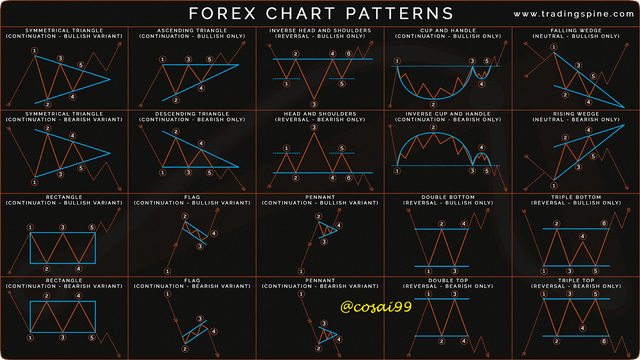
Different patterns are used differently to indicate trends in the market. It is important to know them as they help you perceive either a possible change or continuation in the market trend. Each of these patterns has different strategies for trading and it is recommended that you choose the one that is best suited for you.
Source
Also, it is such that some both function efficiently in either short term or long term or even both. Some of these include Triangle Pattern, Flags, and today's special, Rectangle Pattern. These work differently but may have some similarities.
Rectangle patterns are either used short term or long term but rather effectively used short term if you want to check for a trend reversal. They are very easy to use and beginners can grasp the concept behind this and form strategies suitable to their taste. Other indicators can be used in conjunction with the pattern to further confirm the speculation of the investor. It is important as an investor to perceive these changes so you are never caught off-guard. It must be said that these patterns can give false signals and hence investors should be able to know how to perceive a false signal, otherwise make a rash decision that may result in heavy losses.
Let's get started

Explain Rectangle Pattern in your own words.
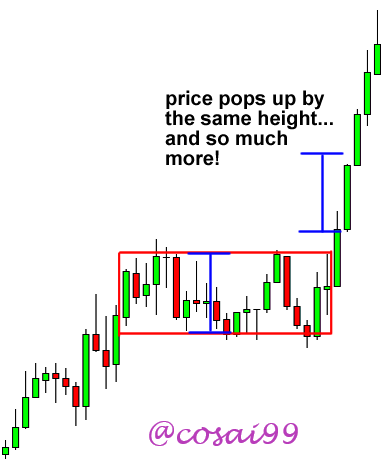
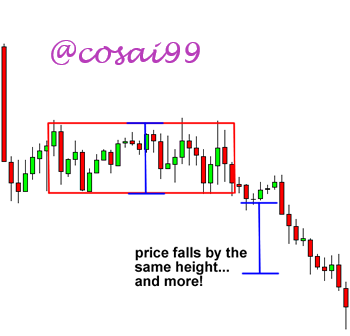
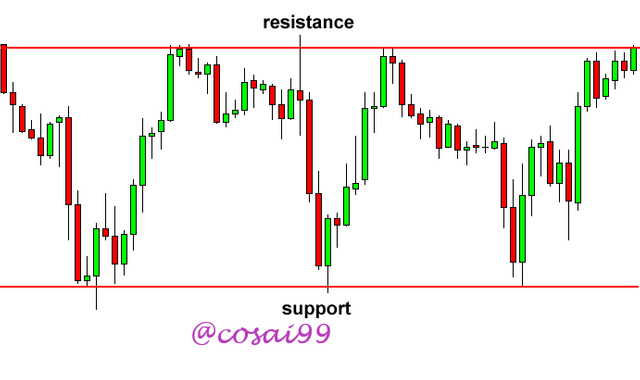
The rectangle pattern is a pattern used to determine if whether the market trend will reverse or continue. It could be taken long term or short term. I will mention when you use the long or short term later. Now, the rectangle can be imagined as an earthworm wiggling its way through a small piece of hollow wood. The earthworm's movements may be seen as the price trend using the Candlestick Pattern and the boundaries of the small piece of hollow wood as the Upper and the Lower trendlines.
Source
The upper trendline is the Resistance Line and the lower trendline is the Support Line. The rectangle pattern is used when there is some sort of consolidation in the market, an indecisive moment between buyers and sellers, normally a ranging trend if you take it long term. This indicates that both parties exert the same market pressure on each other and there is no significant push of the price to either trend, kind of like a tug-of-war. The point at which the candlestick "break" through the boundaries with a high volume is where a trade entry can be made, resulting in either a bullish trend reversal or bearish trend reversal, depending on where it is formed.

How to identify Rectangles. Explain with Screenshots.
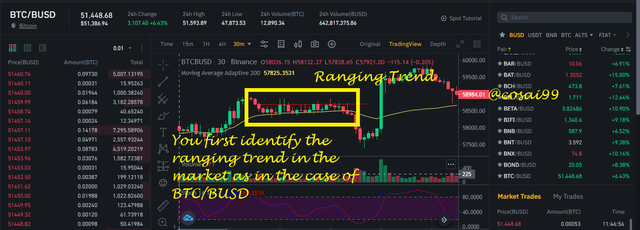
Rectangles normally occur at the ranging trend of the market, where there is a struggle between buyers and sellers, and the pressure offered by either side is equally matched. There isn't any significant movement of price upwards or downwards. Let's take a look at how to identify rectangles.
We must first identify a ranging trend, where there is a struggle between buyers and sellers.
.png)
Captured From Binance
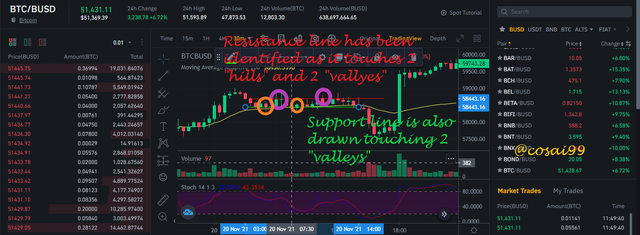
We then draw our resistance trendline, as it touches at least two(2) highs, known as "hills", and our support trendline, as it also touches at least two(2) lows, also known as "valleys".
.png)
Captured From Binance
With these two boundaries,the resistance line and the support line, the rectangle pattern is formed and can be used to derive a strategy.

Can we use indicators with this pattern to get accurate results? Explain with Screenshots.
Indicators must be used together with the rectangle pattern, just to confirm the psychology of the pattern. It is not enough to just use the pattern as it can give false signals. The pattern together with the volume and the Moving Average Convergence Divergence(MACD) indicator can be used to determine the momentum of the price, that is to say, the trend the price follows, whereas the RSI and Stochastic Oscillator Indicators can be used to exit your trade. Let's try to see how these are used.
Using the volume and MACD indicators to determine price momentum
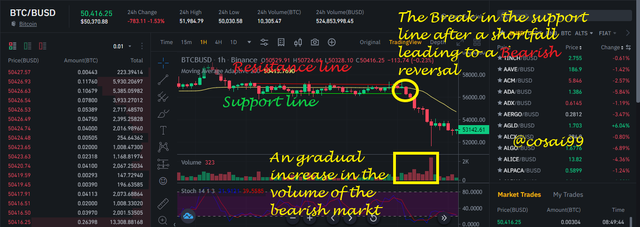
The volume can be used as an entry strategy here when you have the candlestick breaking out of the rectangle. Usually, the volume increases exponentially the moment it breaks, either to the bullish or bearish trend, after consolidation.
.png)
Captured From Binance
In the example above, we can see that the volume in the bearish market gradually starts to increase after consolidation. We then can observe and confirm that the price reversed to the bear market after it had undergone a struggle of power between bulls and bears.
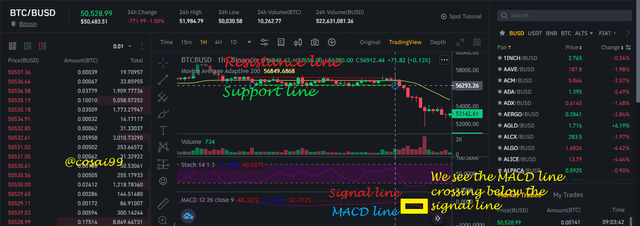
When we add the MACD for extra confirmation, we observe what we see below.
.png)
Captured From Binance
To make a sell, the MACD line has to cross below the signal line. The MACD line is the difference between a 26-period EMA and a 12-period EMA and the signal line is taking a 9-period average of the MACD, say, a smoothen out version of the MACD. We can observe that in the screenshot above and hence we can take a sell position hereafter the breakout.
Adding the RSI indicator
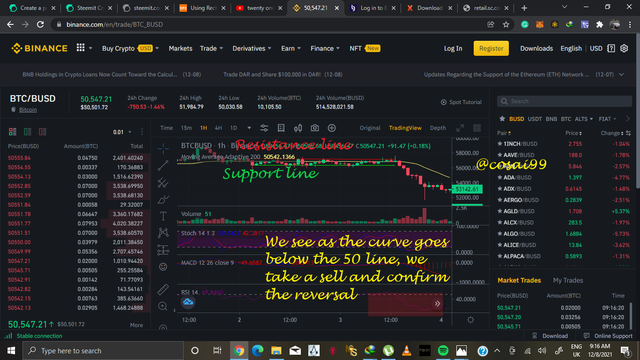
We can add the RSI indicator to further confirm our assertion. we set the values of the RSI to 50.
%202.png)
Captured From Binance
When the curve falls below the 50 line, it indicates a sell market is in operation, hence confirming the breakout in the rectangle pattern in the sell position.
So, we have seen how indicators further prove our assertion about the rectangle pattern.

Explain Rectangle Tops and Rectangle Bottoms in your own words with Screenshots of both patterns.
Tops Rectangle
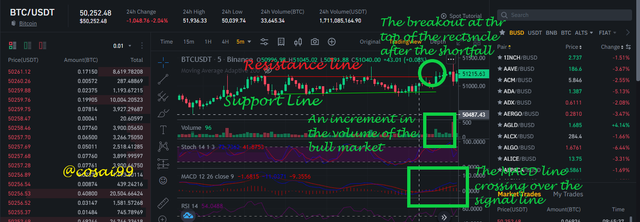
In the tops rectangle, we have the trend entering after a short dip just before entering the rectangle. Just like we discussed, there have to be at least two hills(two touches on the resistance line) and two valleys( two touches on the support line). Then during the consolidation period, there is a shortfall to the support line, halfway there, the candlestick bounces back to the resistance line and crosses it, causing a breakout at the top. an upside breakout. This is the Top Rectangle.
.png)
Caputured from Binance
Bottom Rectangle
Conversely, in the bottom rectangle, there is a short rise before it enters the rectangle. It follows the condition for the rectangle to be recognized as a pattern. During the consolidation period, there is a shortfall to the resistance line and then after, it breaks out at the support line at the bottom and continues a bearish trend in the market as seen below.
.png)
Captured From Binance

Show full trade setup using this pattern for both trends. ( Entry Point, Take Profit, Stop Loss, Breakout)
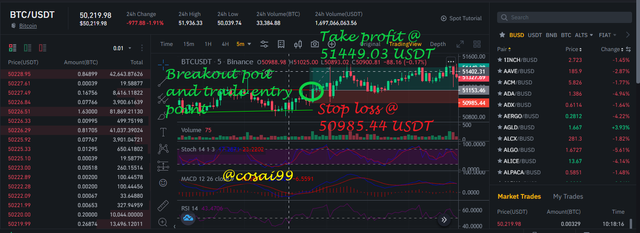
Top Rectangle Trade setup
.png)
Caputured from Binance
Bottom Rectangle Trade setup
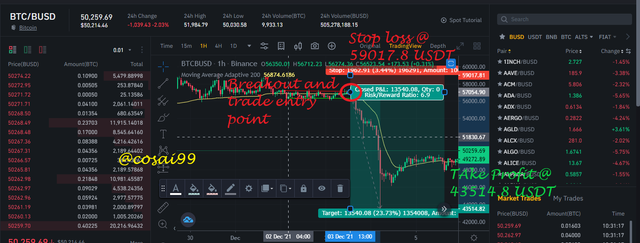.png)
Captured From Binance
We can see that the setups all fulfill what we have been talking about, the conditions and all.

Conclusion
Today, we have seen how the rectangle pattern looks like and how it works. Also, we see how the top and bottom rectangles look like. We have also seen how to combine them with various indicators to make either a buy entry or a sell entry. Using this, we can maximize our profits in our trade and make good investments.
Thank you for reading @sachin08🙏🙏🙏🙏🙏🙏🙏🙏

