Hy steemians hope you are good this another week of crypto academy. Here in this lecture we are understanding the main strategy of traders which can make good profits here we gonna understand price action strategy that is called Market Structure Break Strategy (MSB) which plays vital role for making good profit in to spot and trade reversals. The professor elaborate us the different aspects of the Market Structure lets illustrate the homework in detail.
1 - What do you understand about Market Structure?
CONCEPT OF MARKET STRUCTURE:
Market Structure Break often known as price action pattern formation and widely called the movement of price in the market with the certain patterns formation. You all aware of the price mechanism thaat it moves according to specific way like making a support and resistance levels in each of his dramatical departs. Held,market moves according to different structure and in a construction way for that analysis determined that the patterns always facing three varieties UPTREND DOWNTREND AND SIDEWAYS. Although the key mania for making our management strong regarding market psychology which based on price mechanism patterns, although MARKET STRUCTURE Deals basically with upward and downward trends so according these patterns the market held its formation in MSB strategy.
DETAILED FOR MARKET STRUCTURE:
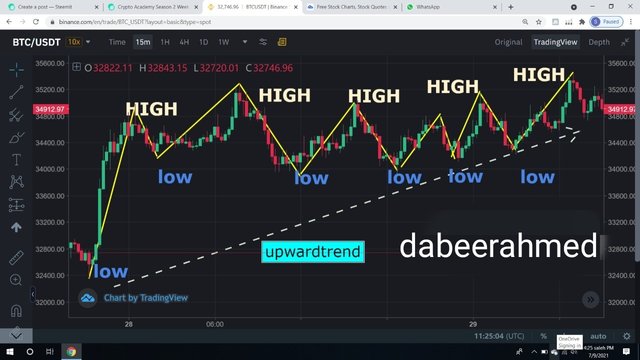
The sequence you might observe in MS series that formation if SWING HIGHS & LOWS commonly known as "UPTREND MARKET STRUCTURE" whilst the SWING HIGH & LOWS will be higher than previous one.
UPTREND:
You will see a series of Swing Highs and lows in an uptrend market structure where the next swing high and lows would be higher than the previous ones. In simple words, you will see price moving in an upward zig-zag pattern going up. I am showing you Bitcoin chart by drawing the swing points in an uptrend market structure so you can clearly understand it.
DOWNTREND:
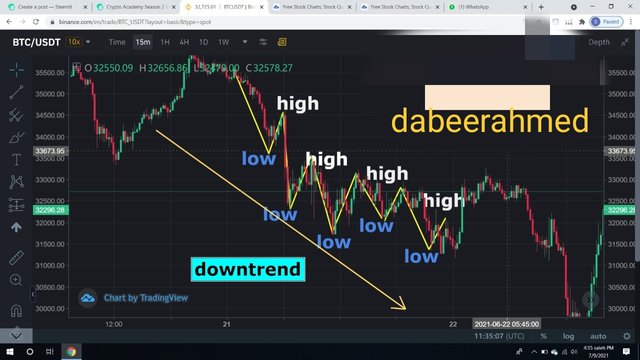
The sequence of Swing lows & and highs in downtrend market formation where you can see the exact next swing lows and highs will be lower than the previous one. That price mechanism shows you the downward structure in a zig zag formation moving towards down path. Lets analysis the btc/usdt chart where you can see the swing points in downward direction.
SIDEWAYS:
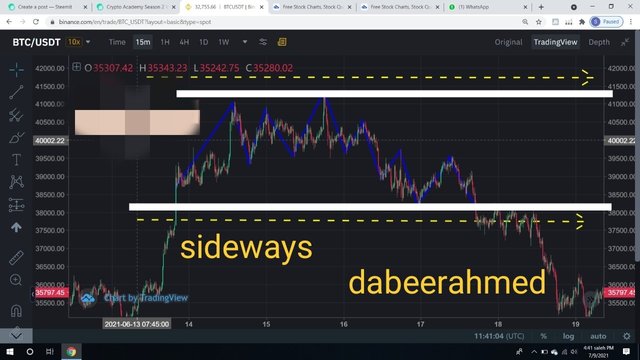
A sideways market, occurs when is in the fairly stable range without making any high and low trends over some range.
2 - What do you understand about Lower High and Higher Low? Give Chart Examples from Crypto Assets.
CONCEPT OF LOWER HIGH AND HIGHER LOW:
The above chart were the illustration of btc/usdt
LOWER HIGH:
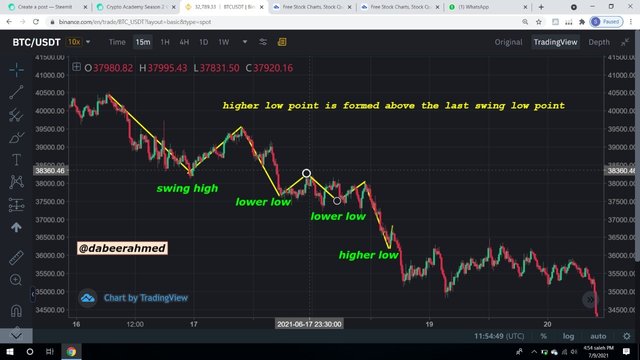
In lower High every trend clearly louds us that every trend that goes up it will definitely be reversed in some time. So the concept totally elaborate us that you will see the swing higher high point formation at the peak of uptrend but if the candle cant break the swing high point and swing high point fails to approached it and make lower than previous swing high point and peaking lower than previous swing high there you will be saw the "LOWER HIGH POINT". More clear vision look the screenshot below;
HIGHER LOW
In higher Low every trend clearly louds us that every trend that every trend might not goes down forever but having reverse point too. This concept what deals the higher low position in market. If the point will be formed at centre of downward but the swing low point cant approaches the previous swing low point and formed above it thus this show you the swing of "Higher low". More clear vision look the screenshot below;
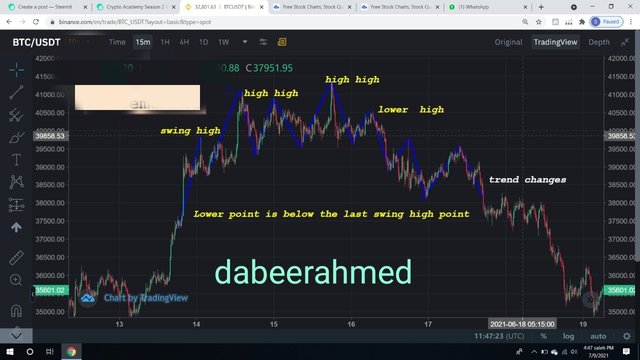
3 - How will you identify Trend Reversal early using Market Structure Break?
USING MSB STRATEGY FOR IDENTIFYING TREND REVERSAL:
So the above illustration was the litmus test of these concept Lower high the main object which generally used for identifying the possible trend reversal points. I will also make bullet points for more clear understanding just like our professor illustrated yet. Three things which is the main criteria for a trader to identify market reversal of UPTREND and DOWNTREND are follows;
Objectives for Upward trend Reversal Early.
1 - Formation of Lower high at top of the uptrend.
2 - Marking the Neckline of Market Structure.
3 - Waiting for the clear break of Neckline.
Above conditions are the management of observing strong downward trend reversal points. So lets see the BTC / USDT pair where you can see the trend reversed action with downward move.
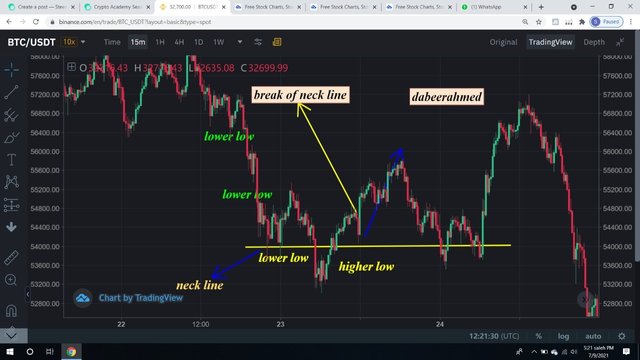
Objectives for Downward trend Reversal Early.
1 - Formation of Higher Low at Bottom of the downtrend.
2 - Marking the Neckline of Market Structure.
3 - Waiting for the clear break of Neckline.
Above conditions are the management of observing strong upward trend reversal point. So lets see the BTC / USDT pair where you can see the upward trend reversed action with downward move.
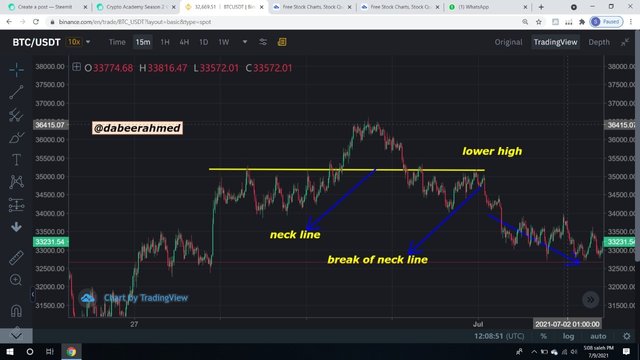
4 - Explain Trade Entry and Exit Criteria on any Crypto Asset using any time frame of your choice.
TRADE ENTRY AREA
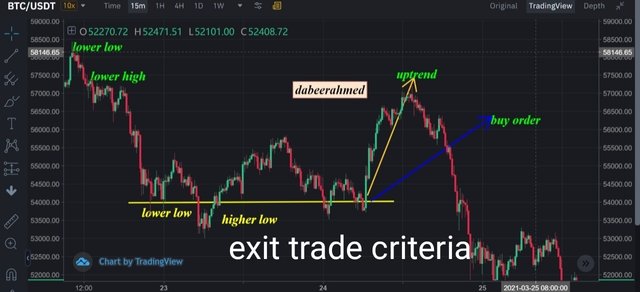
BUY ENTRY CRITERIA:
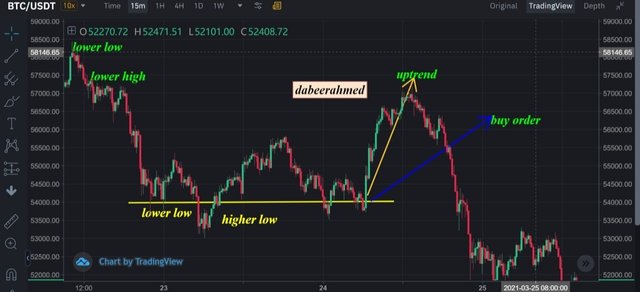
The trend will be deploys same using the trend reversal bullet points remember that. This is the criteria for buyers and the time frame is 4h / 15mins, the bullet points illustrate that;
a) When market showing Downward trend then price must make higher low after a sequencial position of lower lows.
b) Set your neckline after Higher low formation so the management show you the break of neckline.
c) You have to wait until the strong bullish candle joins the way thus it will break through the "neckline" and close above in parallel with previous one and hence the "MARKET STRUCTURE BREAKS"
d) The strategy that I mainly elaborate you are the basis of buying zone thus those analysis are the sideways in the path of MSB buying position. So do take buy trades where your entry point should be above the MSB.
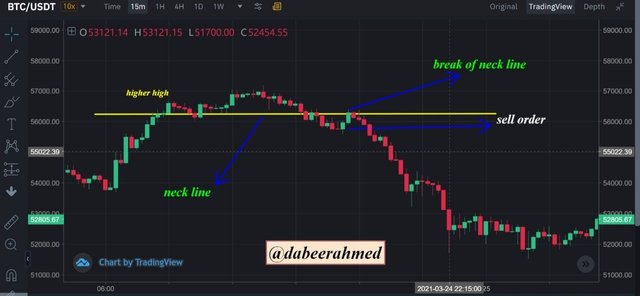
SELL ENTRY CRITERIA
In this same frame working will be used and lets illustrate the bullet points;
a) The essential of this selling criteria main us the market should be in clear uptrend psotion.
b) The market cycle should make Lower high formation illustrated above.
c) The neckline position would probably sett and after the lower high is formed and would give the clear break levels
d) As the clear bearish candle appear then it will break the neckline and breaking the path clearly closing it below. Thus you can see the MAREKT STRUCTURE BREAKS. Now, take the Sell Trade where entry price should be just created below Market Structure Break.
Trade Exit Criteria using MSB:
The trader can be influenced by market because of some criteria that exit him from the market are as follows
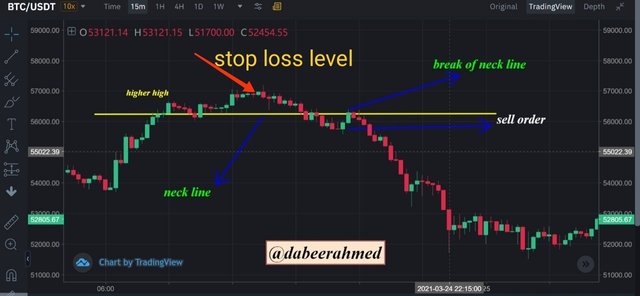
Stop loss criteria
A stop-loss order is an order placed by trader to buy or sell a specific assets once the asset reaches a certain price. A stop-loss Is build to limit an investor's loss and protect him from more loss.
a) Stop loss can be implemented when the strategy of trader is might be wrong.
b) The stop loss must be above the lower high points if not acting such loss might occurs.
c) If not placing the stop loss below the higher of low point might occurs loss.
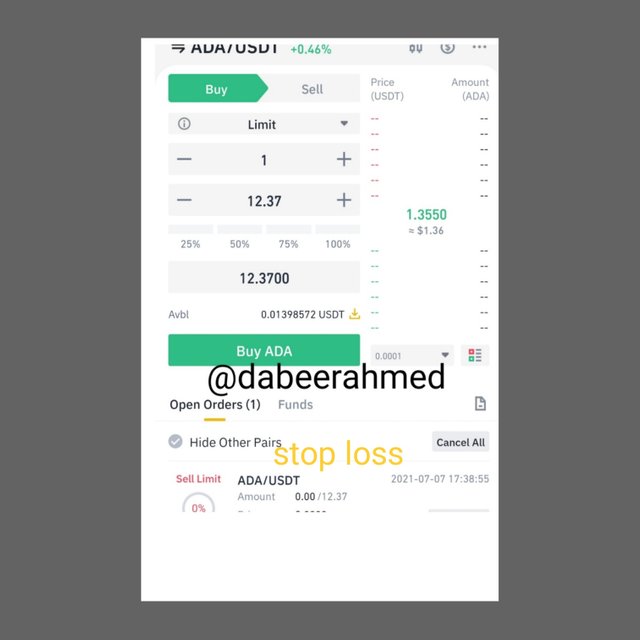
d) In some extreme trades in which trader ain't aware of market completely then If price crosses the stop loss levels the strategy is weaker and you will be exit from the trade might in certain loss according to your position.
Stop loss level:
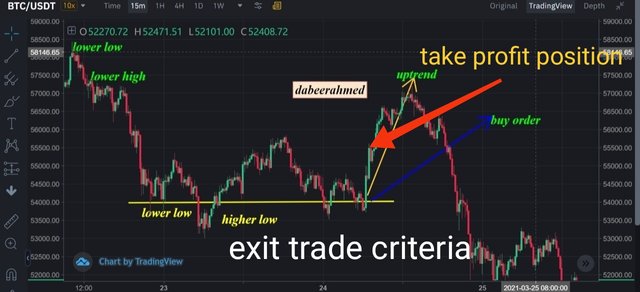
Profit hit criteria:
a) The trader might sett the position of profit scale on his trading desires.
b) The profit obtaining level 1:1 RR as equal to your stop loss
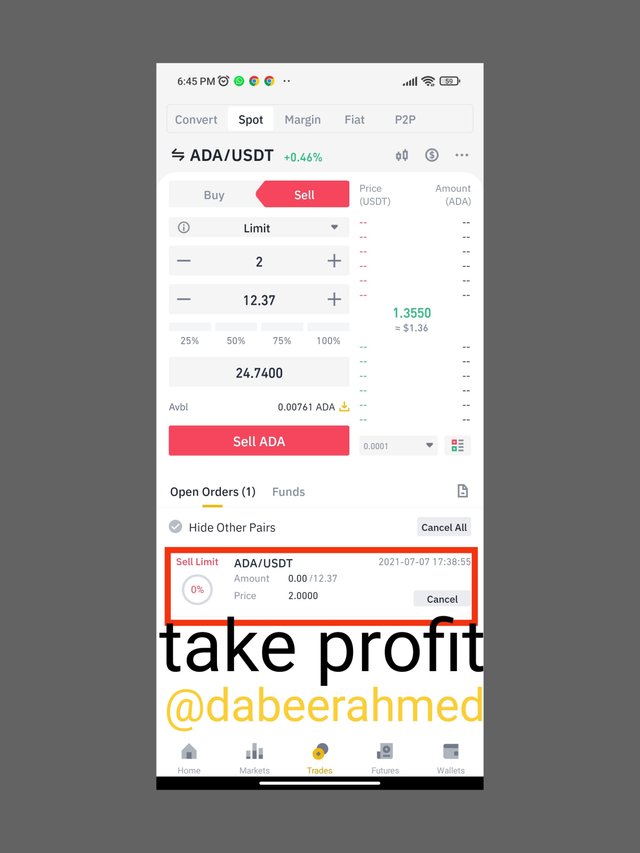
c) When asset hits your price strategy do take profit levels, you can book the profits with your own desires.
d) While taking profit should be put market structure into consideration.
5 - Place 2 demo trades on crypto assets using Market Structure Break Strategy. You can use lower timeframe for these demo trades.
Now lets elaborate some practical module on a crypto asset. I have choosen ADA/USDT for trade because I owned this coin about week ago lets get more detail theory about this coin.
Ada/usdt coin easily show us the market strategy according to above illustrations we had understood. From below screen shot you can see the time frame I uses 15 mins for ADA where the position of 1:1 shows us the position which our professor also discuses though the new trend seems in chart while the previous higher high gets rejection after the lower high candle came, thus new market trend starts.

Now here the structure formation seems to be the break of previous higher high cycle which leads us to obtained new trend which is higher high, and the buy trade signal also assumed in this process I highlighted that too, neck line breaks and new formation of trend seems first lower high and now higher high again.

Now lets examine the profit positions now here the structure I withdraw is the break of higher high which reverted in to lower high then new trend start same as we know but the profit position of this new trend and stop loss can be examine over here. The chart is the clear vision see below.

Trades for stop loss and take profit areas:
ADA/USDT coins performing two trades one on stop loss other take profit.
Conclusion:
This strategy might helps the trader to do better profitable trades. Whilst the lower and higher concept is also the best part where the trader can automatically identify the reversal of market
So the trader use the technical analysis with Indicators and market strategy will definitely score good profit.
So far, Finally attended your class by understanding the MARKET STRUCTURE, honestly speaking the class improves my mistake and trading strategy I might always done in techincal trading but this strategy of analysis the market breaks higher and lower also definite my mind. You explained us in very easy manner.
Thank you professor @cryptokraze for this knowledgeable homework for making our concept more strong.
#cryptoacademy #cryptokraze-s3week2 #steemit #steemexclusive