Yesterday, I learned about HODL waves, How do you interpret a HODL wave, on-chain matrix, daily active addresses, transaction volume, NVT, exchange flow balance and many other things from the post of our respected professor @sapwood and here is my homework task in this regard. So let's get started without wasting much time.

Question no 1:
What is a HODL wave, how do you calculate the age of a coin(BTC, LTC) in a UTXO accounting structure? How do you interpret a HODL wave in Bull cycles?

HODL Wave:
As we know that the word HODL in cryptocurrency stands for "hold on for dear life" which refers to keep holding the asset even if the value of that asset drops to all time low. In the world of cryptocurrency the person who holds his/her coins or asset and never sold it when the value of the asset drops are the most successful crypto traders.However, the HODL Wave is a type of on-chain metric that categorises the entire supply of coins by lifespan, so we create a series of age bands ranging from one year to two years or two years to three years, and on the lower end, we have hourly, one day to one week, or one week to one month, so we categorise the entire supply based on when each utxo was created. It also gives us a relative perspective of the supply's age, allowing us to observe the proportion of old vs new coins, and when we see variations in the trend of these distinct brands, it gives us a picture of the market's macro spending or accumulation patterns through the use of color schemes.
The HODL wave utxo chart for bitcoin is shown in the image below;

Image source
The hodl wave color scheme uses two different types of colors, one is hot colors and the other one is cool colors as shown in the chart above. The hot colors are seen at the lower part of the chart and the cool colors are seen at the upper part of the chart.
Calculating the age of coin with HODL wave:
The age band Color scheme is used to calculate a coin's age based on unspent transaction outputs (UTXO) utilising the HODL wave. I'll go over each section in detail below:
Hot Colors:

Image source
The hot colors show recent unmoved coin ratio actions, which were measured throughout time intervals of 24 hours, 1 day to 1 week, 1 week to 1 month, 1 month to 3 months, 3 month to 6 months, and 6 months to 12 months.
Cool colors:

Image source
The cool colors represent older unmoving coin ratio actions, which were measured using age bands of 1 year to 2 years, 2 years to 3 years, 3 years to 5 years, 5 years to 7 years, and 7 years to 10 years.
How to interpret HODL wave in bullish cycle:
When the older age band widens, it implies a rise in the percentage of undisturbed coins in wallets, indicating limited UTXO spending and as a result a drop in the coin's supply is noticed. And we know that when the supply of the coin drops the demand of that coin rises automatically which results in the increase in the price of a coin which shows the bullish phase of the asset.

Image source
If we pay attention towards the above given screenshot, we know that in the lower side there are recent transactions which are made in the time interval of 24 hours, a day. But if we look at the upper side of the image we know that there are older coins which are not transacted yet, so if when these upper color band increases it means that the supply of the coins is less and when the supply of the coin is less then the demand increses automatically, thus the bullish phase of market is seen.
There have been three major HODL waves is seen in Bitcoin's bull wave in the history so far namely;
- Genesis HODL wave.
- The HODL of 2011.
- The Great HODL wave.

Question no 2:
Consider the on-chain metrics-- Daily Active Addresses, Transaction Volume, NVT, Exchange Flow Balance & Supply on Exchanges as a percentage of Total Supply, etc, from any reliable source(Santiment, Coinmetrics, etc), and create a fundamental analysis model for any crypto[create a model for both short-term(up to 3 months) & long-term(more than a year) & compare] and determine the price trend (or correlate the data with the price trend)w.r.t. the on-chain metrics? Examples/Analysis/Screenshot?

Daily Active Addresses:
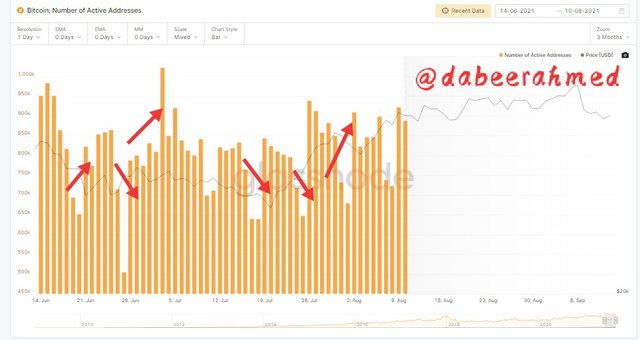
The daily active address represents the number of active Bitcoin addresses based on every movement of the price change in the on-chain metrics. It is used to receive or send the asset. These on=-chain matrices moves accordingly the price the price of asset.
Short term Chart (3 Years):
Screenshot captured from Glassnode
In the above given image we can see that there is dates present in the x-axis and prices are present on the y-axis of the chart. And here we can clearly see that the increase in number of active addresses is correlated with the increase in the price movement which means that the price will also increase if number of active addresses increases but decrease in the number of active addresses will result in the downward movement of the price.
Long Term Chart (2 Years):
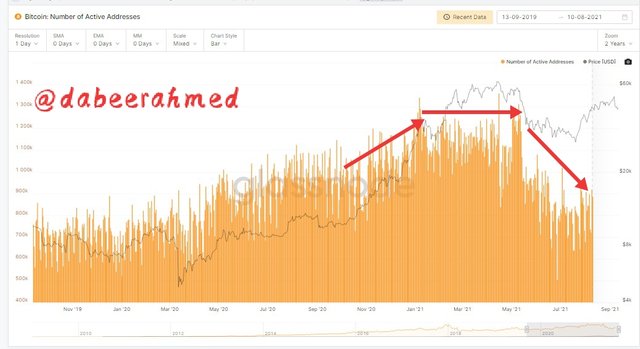
Screenshot captured from Glassnode
In the above given image you can see that the long term chart also shows the number of active addresses is correlated to the price movement. Increase in the number of active addresses will will lead to the upward trend of price movement and vice versa.
Transaction Volume:
Transaction Volume on-chain matrices denotes the coin exchange operations within a network. It denotes the amount of transaction or the volume of transaction that is carried out in the market. It does not corelate with the price movement.
Short Term Chart (3 months):
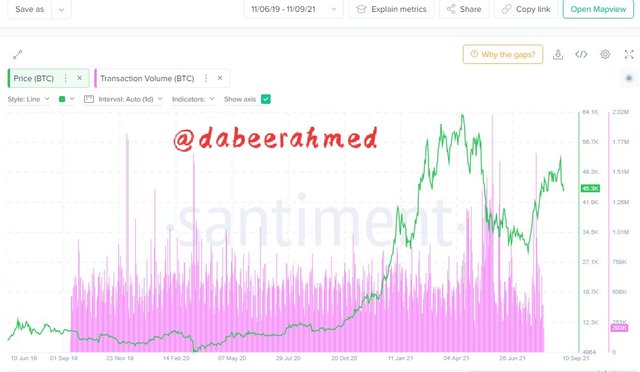
Screenshot captured from santiment
As you can see in the above given image that the trading volume and the price movement line does not match in the same direction. But here the rise and fall of the the price can be seen by the help of spike.
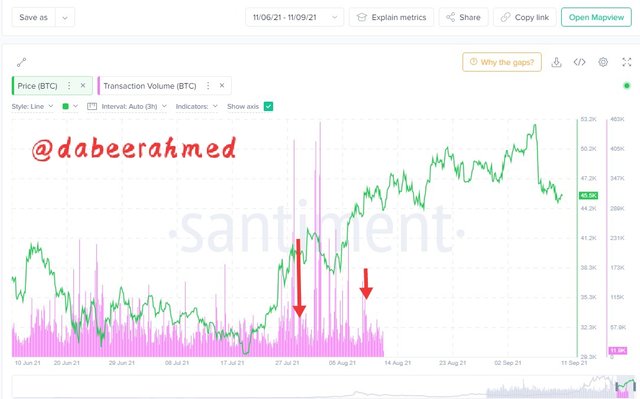
Long Term Chart (2 Year):

Screenshot captured from santiment
Here in this image you can see that the long-term transaction On-chain volume data also demonstrate a misalignment between price movement and on-chain matrices. But spikes, on the other hand, form before the price travels higher or lower as shown in the image above.
Network Value to Transaction Ratio (NVT Ratio):
The network value to transaction ratio (NVT ratio) is used to know the actual worth of a crypto asset. To know the network value to transaction ratio(NVT) we have to divide the total marketcap of the asset with the transaction volume of that asset. There are two network value to transaction ratio (NVT), a higher bound and a lower bound. The high bound implies that the asset is overvalued, and that a downward trend is likely to occur shortly. The lower bound, on the other hand, represents the asset's undervalued state, indicating that an upward change is likely.
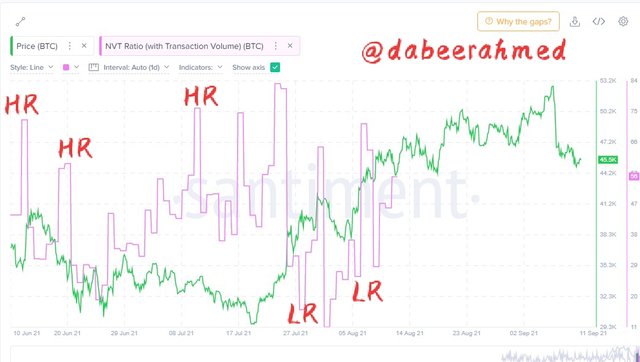
Short Term Chart (3months):
.jpeg)
Screenshot captured from santiment
In the above chart the NVT high reading (HR) indicates as over value and decreasing price movement while the NVT lower reading (LR) indicates as under value increasing price movement.
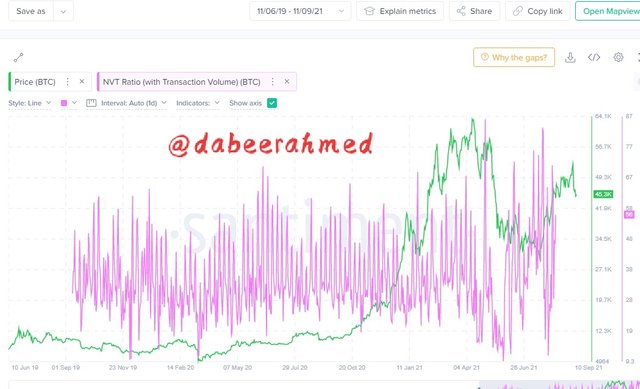
Long Term Chart ( 2 years):
Screenshot captured from santiment
In the long term network value to transaction (NVT) indicates the drop and the rise in the price movement by the formation of higher and lower bound.
Exchange Flow Balance:
The exchage flow balance matrices is derived from exchange inflow and exchange outflow. Here exchange inflow indicates the downward trend in price movement because here supply increases so the price decreases. And exchange outflow indicates the upward trend in price movement because here supply decreases which results in the increasing of the price.
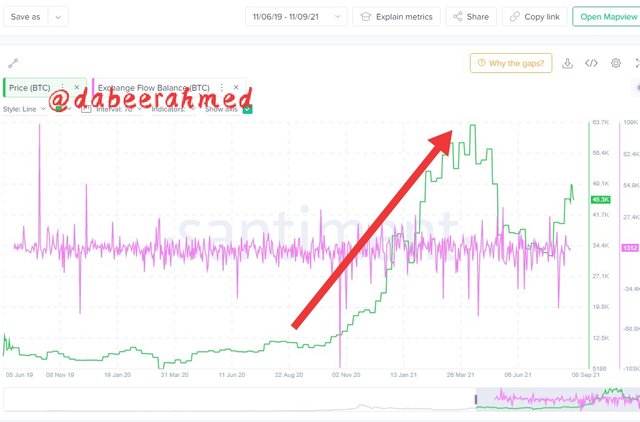
Short Term Chart ( 3 months):
Screenshot captured from santiment
In the above short term exchange flow chart we can see that the on-chain matrices is providing false signal and the exchange flow is skewed.
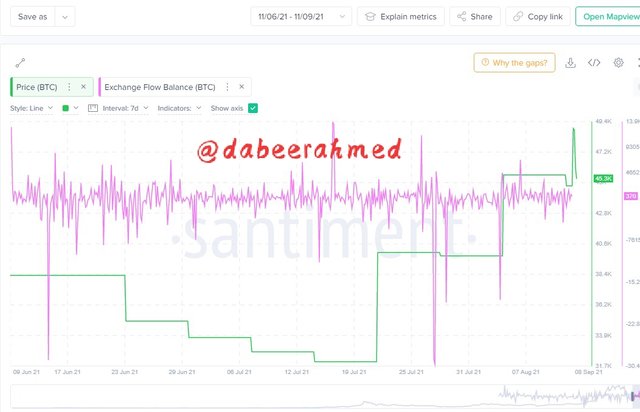
Long Term Chart ( 2 Years):
Screenshot captured from santiment
If we look at the above given image of long term exchange flow chart we can see that the on-chain matrices shows show a historical increase in price after exchange outflow and the exchange flow is also not disorted.
Supply on exchanges as a percentage of total supply:
The supply on exchanges as a percentage of total supply on the on-chain matrices is inversely proportional to the price movement of an asset which means that if the supply percentage of a coin increases the price movement of that coins shows downward trend and if the supply percentage decreases then the price movement of that coins will show upward trend. The total supply of a coin is the amount of it that has been transferred to exchange wallets and This has an impact on a coin's value.
Short Term Chart (3 months):
Screenshot captured from santiment
In the above given chart you can easily see the inverse relation of supply and price movement.
Long Term Chart (2 Year):
Screenshot captured from santiment
Long term chart also shows the same inverse relation between supply and price movement.

Question no 3 :
Are the on-chain metrics that you have chosen helpful for short-term or medium-term or long term(or all)? Are they explicit w.r.t price action? What are its limitations? Examples/Screenshot?

On-Chain matrices:
On-chain indicators, in my opinion, are always favourable for long-term investment. This is due to the fact that the signal obtained while employing the long term is more distinct and consistent. So, if you want to employ on-chain metrics, set a time range from 1 to 2 years, 2 to 3 years and so on to get a clear and better signal. I noticed that numerous false signals can be generated particularly when used in the short or medium term, as in the case of the Exchange flow balance. So, if you want a better and more consistent result, aim for the long term.
On-Chain matrices and price action:
With regard to price, the on-chain matrices are fairly obvious. It follows the principle of supply and demand which determines the price changes of that coin or an asset. Price action on the on-chain matrices is the result of a collaboration between buyers and sellers that determines supply and demand but not all on-chain matrices can be used to correlate price changes.
Limitations:
Despite a lot of pros their are also some limitation and cons of on-chain matrices such as it sometime provides unclear and inconsistent signal for short and midterm investing as it is only reliable to long term signals. Another limitation of on-chain matrices is that it is very hard to do analysis of different crypto coins using it because most of the coins are new and as I said earlier that it generate false analysis for short and mid term. It can only provide explicit information of only bitcoin and ethereum because bitcoin is the only coin which is more then a decade old and on the other hand ethereum is also 6 year old coin.

Conclusion:
The on-chain matrices is an important tool which is mostly used by trader to analyze the position of the market. According to demand and supply concepts, on-chain metrices also frequently correspond with price movement of the asset. There are a lot of advantages of on-chain matrices such as we can determine the age of any crypto asset, we can interpret if the market is bullish or bearish and many other. However it also contains also a few disadvantage of it such as the generation of false signals in mid and short term range. It is also very useful in generating consistent long term signals. Despite all the pros and cons on-chain matrices is an important tool which is still use a lot y almost every second trader.
Cc: @sapwood
Regards: @dabeerahmed
