
Question no 1
What is Aroon Indicator in your own words? What are Aroon-Up and Aroon-Down? (Show them on Chart).

Aroon Indicator
Tushar Chande, a technical analyst who contributed to the development of several indicators, including the Qstick, Chande Momentum, and Aroon Oscillator. Aroon indicator is another of his best-developed indicators, which is primarily utilized in trend detection.
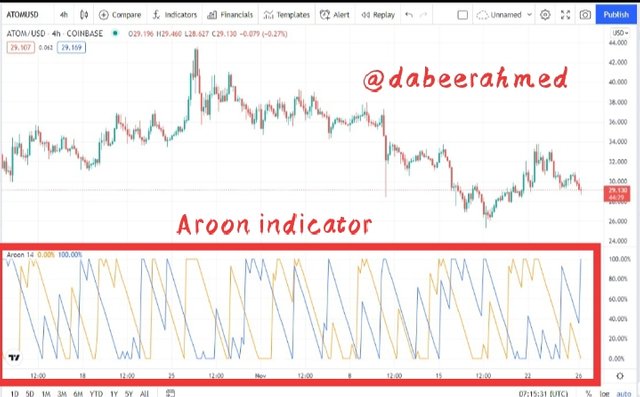
Traders utilize the Aroon Indicator as one of their technical indicators. It's used to show whether there are any trends, how they're changing, and how strong they are. It assists a trader in studying and comprehending the price behavior of an asset over time, providing him with crucial information on whether to enter or exit a trade. It also benefits a trader in determining whether a trend is there or absent. It moreover allows a trader to determine whether or not the trend is strong.
It features a 0 to 100 scale. Most versions of the Aroon Indicator have two lines, Aroon up and Aroon down, that can be used to determine the strength of the trend on either side. It also comes in the form of a single line that indicates trend on a scale of 100 to -100. The Aroon indicator is easy to use, and the placement of the two lines i.e. Aroon up and Aroon down makes it simple to interpret the current trend.
Screenshot Captured from tradingview.com
Aroon Up
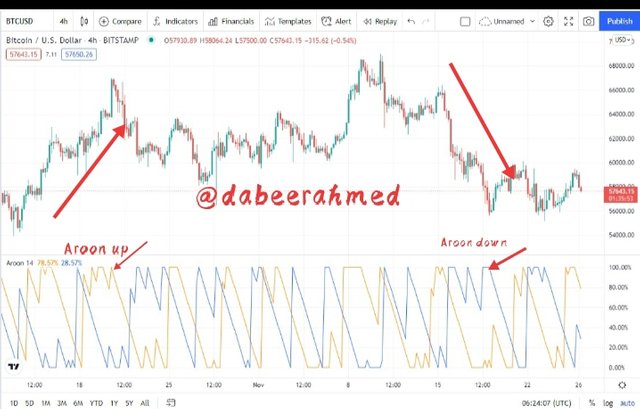
The Aroon Up is one of the Aroon Indicator's two lines. On a scale of 0-100, the strength is assessed. This Aroon up line assists us in determining the price of a market in an upward trend, as each subsequent high price movement pulls the Aroon-up closer to the indicator's top bound (100). By crossing and staying above the Aroon down line, the Aroon up line verifies the bullish price movement.
Aroon Down
This is the Aroon Indicator's second line. In contrast to the Aroon Up line, it is connected with price downtrend movement, as each succeeding low price movement pushes the Aroon-down closer to the indicator value's top bound (100). By crossing and remaining above the Aroon-up line, the Aroon-down line, in principle, verifies price's bearish movement.
Screenshot Captured from tradingview.com

Question no 2
How is Aroon-Up/Aroon-Down calculated? (Give an illustrative example).

The Aroon-up and Aroon-down lines have a mathematical equation that expresses the concept of time in relation to price difference, and it is as follows:
Aroon Up = 100 x [(nperiod - Number of periods from the previous 25 Period High) / nperiod]
Aroon Down = 100 x [(nperiod - Number of periods from the previous 25 Period low) / nperiod]
Here;
nperiod = The period used for the analysis e.g. 25.
Below is the calculation of Aroon up;
If the observation period is 25, and the price readings on an ETHUSDT chart are as follows:
High Price: $3,650
Period since high price: 12
Aroon Up = 100 * [(25 - 12) / 25)]
Aroon Up = 100 * (13 / 25)
Aroon Up = 100 * 0.52
Aroon Up = 52
With an Aroon-up value of 52, it's safe to assume that the asset price has recently reached a new high or that the bullish trend has just begun.
Now, the calculation of Aroon Down is as follows;
If the observation period is 25, and the price readings on an ETHUSDT chart are as follows:
High Price: $3,300
Period since high price: 10
Aroon-down = 100 * [(25 - 10) / 25]
Aroon-down = 100 * (15 / 25)
Aroon-down = 100 * 0.60
Aroon-down = 60
The Aroon-down value of 60 indicates that the asset price has recently made a low or that the downtrend is relatively strong.

Question no 3
Show the Steps involved in the Setting Up Aroon indicator on the chart and show different settings. (Screenshots required).

I will be using Tradingview.com platform to demonstrate how to add Aroon Indicator indicator on the trading chart . To begin, go to Tradingview.com and finish the registration process. Click the charts button after logging in to the website.
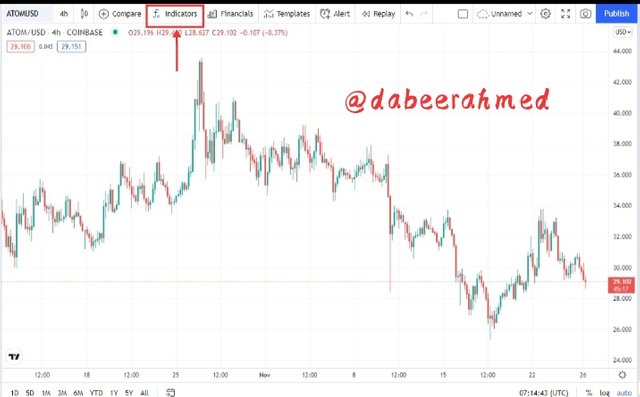
- After getting into the chart click on indicators button which is situated at the top of the chart; pressing the indicator button will bring up an indicator screen. Select Aroon indicator after typing Aroon. The screenshots are provided below;
Screenshot Captured from tradingview.com
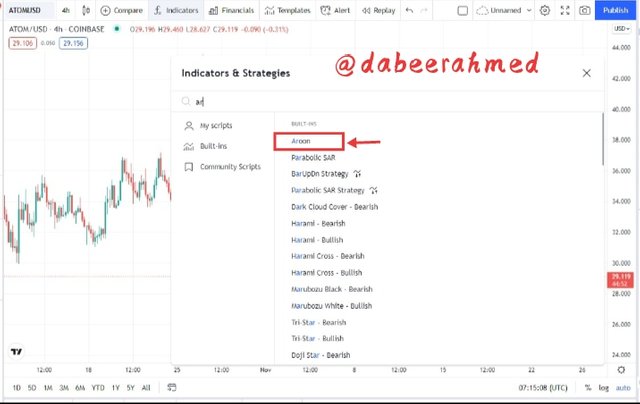
Screenshot Captured from tradingview.com
- Aroon indicator is now added to your chart as shown in the image below;
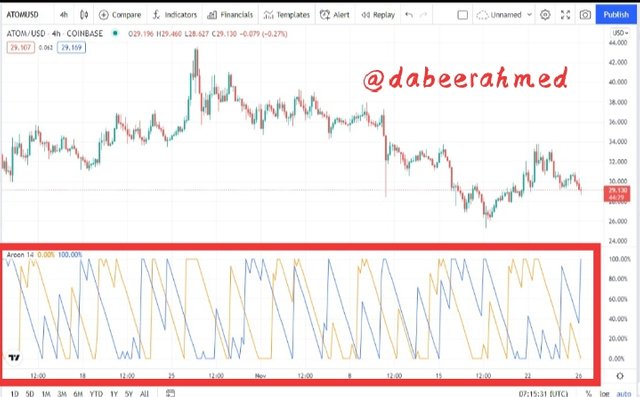
Screenshot Captured from tradingview.com
- To adjust the configuration of Aroon indicator, click on its settings.
- After clicking on the Aroon indicator's settings, you may now adjust the indicator's configuration as desired. The period of the indicator can be changed using the input bar, which is set to 14 by default. From the Style tab, you can also change the colour and styling of the lines. The Aroon indicator's period has been set to 25. Below are screenshots of each step of the procedure;
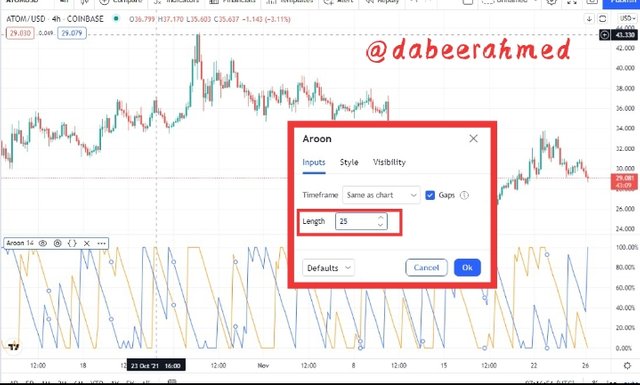
Screenshot Captured from tradingview.com
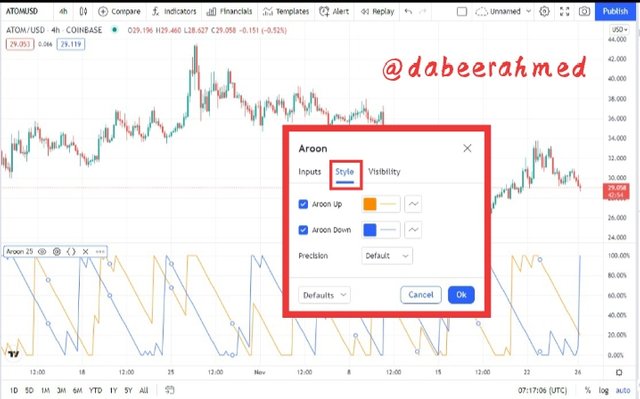
Screenshot Captured from tradingview.com
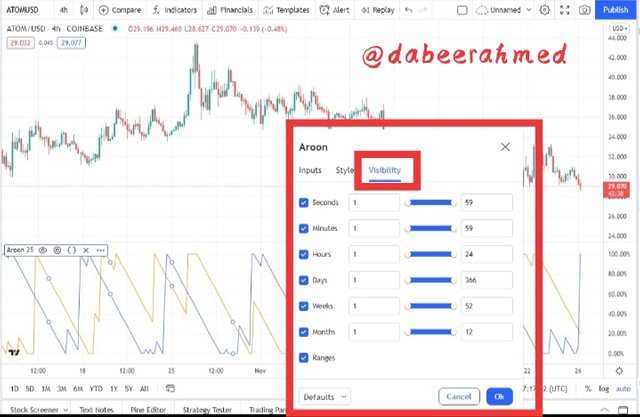
Screenshot Captured from tradingview.com
- After setting all your desired options, Aroon indicator is now successfully added to your chart and is now ready to use;
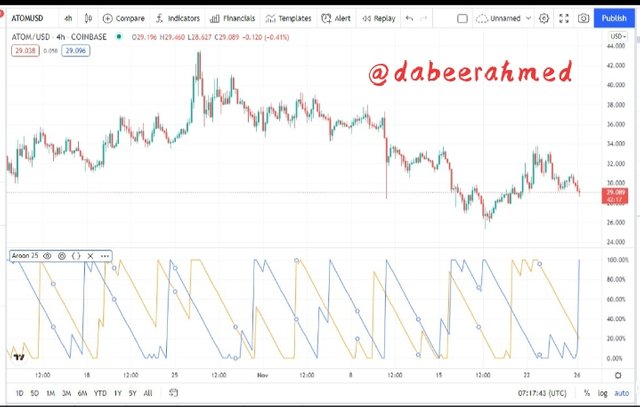
Screenshot Captured from tradingview.com

Question no 4
What is your understanding of the Aroon Oscillator? How does it work? (Show it on the chart, kindly skip the steps involved in adding it).

Aroon Oscillator
The Aroon Oscillator, I'd say, is a subset of the Aroon Indicator, since instead of having two lines, Aroon Up and Down, the Aroon Oscillator just has one line that fluctuates between -100 and 100. The difference between the Aroon up line and the Aroon down line is used to calculate the Aroon oscillator. The Aroon Oscillator is another useful instrument for identifying the momentum, direction, and possibilities of a trend shift. The Aroon Oscillator has a zero midpoint, which is essential for good entry and exit signals.
Indication Of Strong Trends
The Aroon oscillator works by indicating trend momentum with its movement, so that in an uptrend, the oscillator goes close to the bound market 100's upper limits. A move around the 100 mark, in theory, implies the possibility of a strong uptrend.
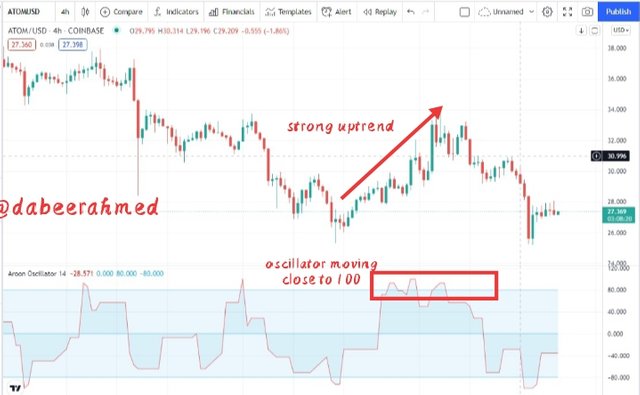
Screenshot Captured from tradingview.com
The oscillator swings near to the bottom limits of the bound market -100 in a downtrend. A move towards the -100 level, in theory, implies the possibility of a significant decline.
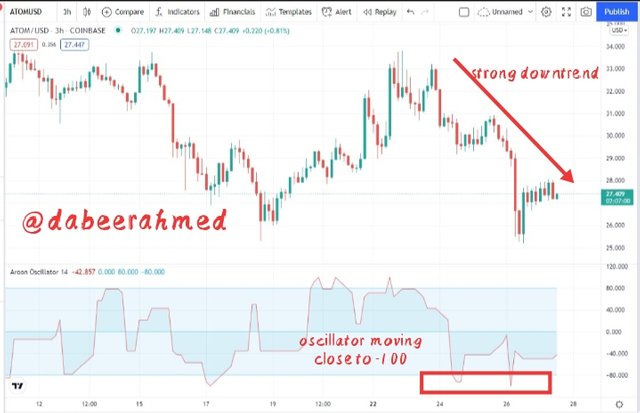
Screenshot Captured from tradingview.com
Indication Of Trend Changing
As previously stated, the 0 or midpoint serves as a critical mark in the Aroon Oscillator. When the Aroon Oscillator goes from above the midpoint in a downward direction, it indicates a price downturn; conversely, when the Oscillator travels from below the midway in an upward direction, it suggests a price uptrend. So the Aroon oscillator, with its cross above or below the midpoint 0, detects a trend change.
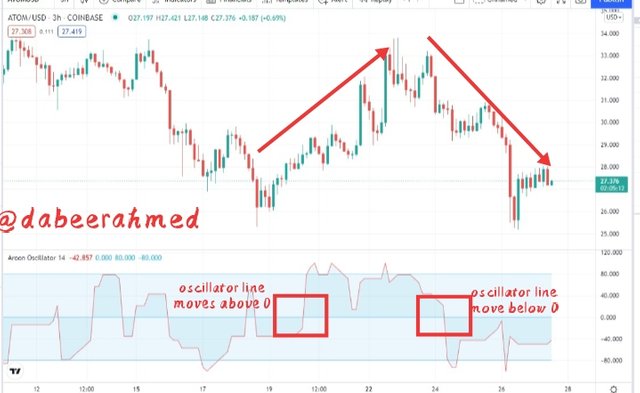
Screenshot Captured from tradingview.com

Question no 5
Consider an Aroon Indicator with a single oscillating line, what does the measurement of the trend at +50 and -50 signify?

Measurement Of Trend at +50 and -50 Oscillator range
The Aroon Oscillator assists us in identifying the strength of a continuous trend as well as its variations. We already know that if the Oscillator ranges around positive values, closer to 100, it indicates an uptrend, and if it ranges around negative values, closer to -100, it indicates a downward trend. A price movement of +50 shows that the price is trending upward. If the price rises even higher than the +50 level, it indicates that the rising trend is well-established. Similarly, if the Oscillator shows a -50 value, the market is in a decline. If the price falls even lower than the -50 level, it indicates that the downtrend is well-established
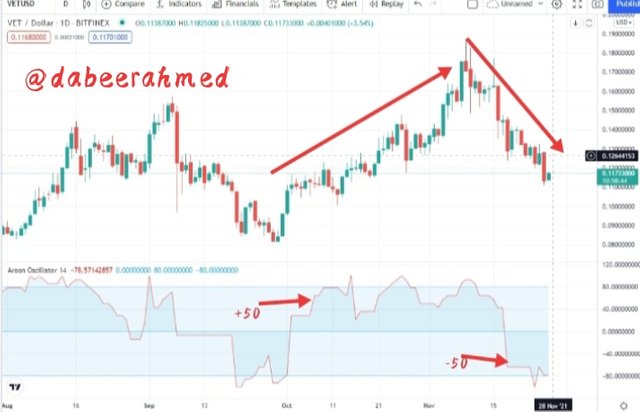
Screenshot Captured from tradingview.com

Question no 6
Explain Aroon Indicator movement in Range Markets. (Screenshot required).

Movement Of Aroon Indicator in Range Market
A range market is one in which there are no clear trends, either bullish or bearish, but instead the price goes sideways. In a ranging market, neither the buyers nor the sellers have complete control in the market. The Aroon indicator lines (Aroon-up and Aroon-down) mirror each other's movement in a ranging market. The battle for pricing control is shown by the sideways movement.
With its lateral movement of its line (Aroon-up and Aroon-down), the Aroon depicts this type of market scenario, with no cross-over of the line above or below each other.
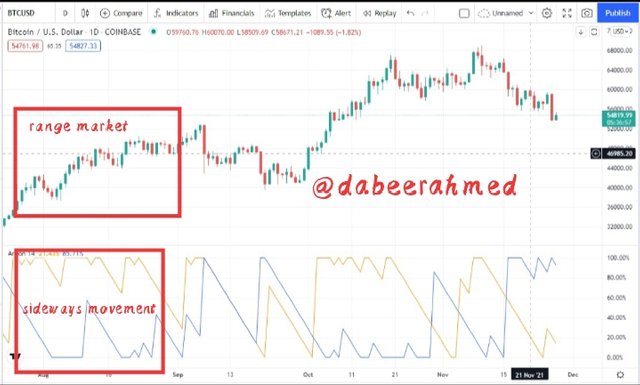
Screenshot Captured from tradingview.com
The Aroon lines in the chart above suggested that there is no ongoing trend in the market, and the Aroon Indicator was moving sideways with no crossover.

Question no 7
Does Aroon Indicator give False and Late signals? Explain. Show false and late signals of the Aroon Indicator on the chart. Combine an indicator (other than RSI) with the Aroon indicator to filter late and false signals. (Screenshots required).

False Signals by Aroon Indicator
Like any other indicator in the crypto market, the Aroon Indicator is prone to mistakes and occasionally gives out false signals. Along with erroneous signals, it can also send out lagging signals, which means it sends out signal late at times by which the trader sometimes get confused oe sell their trades at loss..
The Aroon Up line crosses the Aroon Down line on occasion, indicating a possible buy signal. The market, on the other hand, does not move upwards, but rather downwards which means that the indicator has produced false signal. Consider the chart below which shows an example of a false signal;
.jpeg)
Screenshot Captured from tradingview.com
In the above provided chart you can clearly see that aroon up moved up the aroon down but the price didnot moves up and it moves downwards instead.
Late Signals by Aroon Indicator
Because the Aroon indicator's calculated values are taken from past price data, it is a lagging indicator. This means that the Aroon indicator has a proclivity for generating trade signals late, as price development occurs before the indicator values are computed. Take a look at the graph provided below;
.jpeg)
Screenshot Captured from tradingview.com
Combining other Indicator with Aroon Indicator
The moving average indicator approach is a common trading strategy that employs crossing moving average lines above or below one another to provide buying or selling signals. The effect of late signals and misleading generated signals is considerably reduced when the moving average is combined with the Aroon indicator. Take a look at the graph provided below;
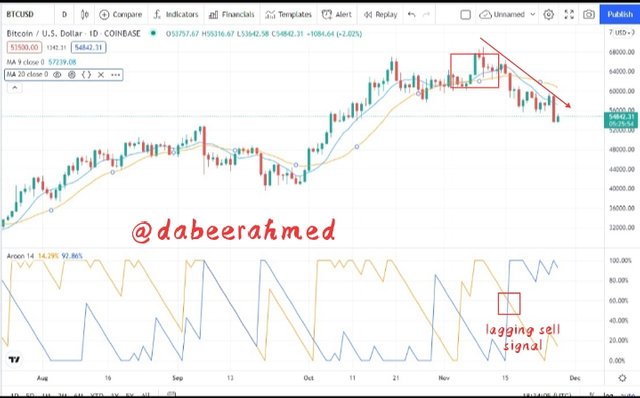
Screenshot Captured from tradingview.com
The MA lines provided the purchase signal before the Aroon Indicator in the example above, which was a solid choice to overcome the lagging effect connected with the Aroon Indicator.

Question no 8
Place at least one buy and sell trade using the Aroon Indicator with the help of the indicator combined in (7) above. Use a demo account with proper trade management. (Screenshots required).

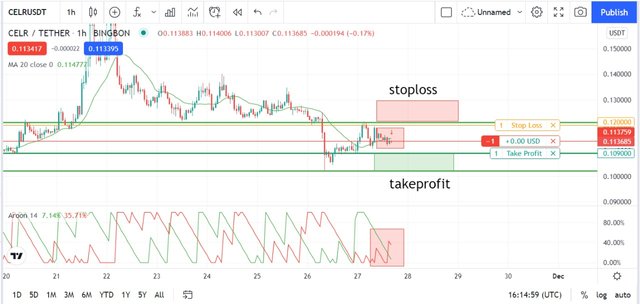
CELR/USDT Sell Trade
I have placed a sell/short order on the CELRUSDT pair. Using a combination of the Aroon indicator and the moving average, I was also keeping a check on the market. The Aroon-up line is now lower than the Aroon-down line. The MA cross line is now above the candles as well. As a result, I decided that it was a good time to sell/short because such activity usually predicts a decline in price.
Screenshot Captured from tradingview.com
CELRUSDT was trading at $0.1136 at the moment, so I placed my take profit at $0.1090 and my stop loss at $0.1200.

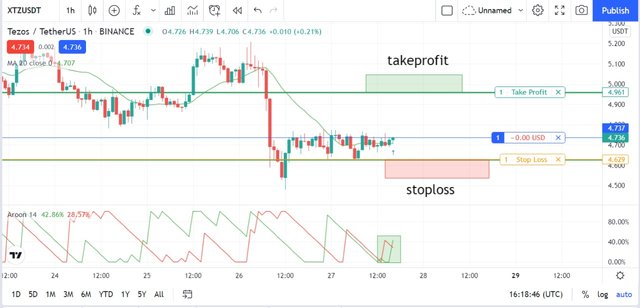
XTZ/USDT Buy Trade
On the XTZUSD pair, I placed a Buy/long order by u sing a combination of the Aroon indicator and the moving average, I was also keeping a watch on the market. The Aroon-down line is now lower than the Aroon-up line. The MA cross line is now below the candles as well. As a result, I determined that it was a good time to Buy/long because such activity implies an upswing.
Screenshot Captured from tradingview.com
XTZUSDT was trading at $4.737 at the moment, so I placed my take profit at $4.961 and my stop loss at $4.629.


Question no 9
State the Merits and Demerits of Aroon Indicator.

Merits Of Aroon Indicator
- With the crossover of either the Aroon-up or the Aroon-down, the Aroon indicator gives trading indications. Investors and traders will benefit from this because buy and sell signals may be easily spotted.
- The Aroon Indicator is extremely simple to use and comprehend, as it involves no advanced-level concepts that are difficult to grasp. There are only two lines, which represent the signals.
- It can also be used to determine trend strength; a trend above +50 or -50 indicates a strong bullish or bearish trend.
- With the Aroon Lines (Aroon-up and Aroon-down) representations, the Aroon indicator also serves invertors and traders in identifying the current trend, the probability of the current trend altering, and the strength of the trend. This is quite beneficial and effective.
Demerits Of Aroon Indicator
- Because of how its numbers are calculated, the Aroon indicator is regarded as a lagging indicator. The figures are based on previous pricing data, which has no effect on the present price trend. As a result, late signals and erroneous signals are frequent.
- Though using multiple indicators simultaneously to generate a single correct signal may be a good idea to reduce your trading risks, it can be a pain at times.
- Another disadvantage of this indicator is that it provides late indications, as it indicates delayed development, resulting in the loss of potentially profitable trade positions or the late entry of trades.
- Fake signals may cause crossovers to produce inaccurate results.

Conclusion
The Aroon Indicator assists us in determining the trend, its strength, momentum, and potential trend shifts. It is made up of the Aroon Up and Aroon Down lines, which move between -100 and 100. If the Aroon Up is close to 100, it suggests a strong ascending trend; similarly, if the Aroon Down is close to -100, it indicates a strong downward trend.
To reduce the influence of latency and lagging price movement, and to effectively filter out erroneous Aroon indicator signals, it's recommended to combine the indicator with other indicators like Moving averages (MA), bollinger bands, Relative strength index (RSI) and so on.

@fredquantum, Professor Thank you for a wonderful and instructive lecture. I learned a lot from this lesson, and I'm looking forward to hearing more fantastic lectures from you in the future:)
Regards, @dabeerahmed
#club5050 #fredquantum-s5week2 #cryptoacademy #steemit #steemexclusive