Hi guys!!
We've been waiting long enough for SCA season 6, finally our wait is over. In this first week, I will directly work on the homework from professor @dilchamo, so this is the result of his homework.

1. Define Line charts in your own words and Identify the uses of Line charts.

Everyone who works in cryptocurrencies knows the benefits and uses of charts. Almost everyone uses the information displayed by the chart before investing, because basically the chart is a tool that serves to see the reaction and market movements. As we know, there are various types of charts that can be used to perform technical analysis of a security. Among them is Chart Line, which we will discuss this time.
Chart Line is a chart that is widely used because it is a basic chart that is easy to use and understand. Chart Line gives us a historical price representation with a continuous line of a security. Why it is widely used, because Chart Line only shows the closing price of a security over time, making it easier to use and understand.
The noise caused by the opening, high, and low prices, we will not get on the chart line, which makes it easier for traders to catch signals from the chart. Because the Chart Line only connects the closing price from time to time with only one very simple line, it allows us to use price history to make trading decisions.
Use of Line Charts
Basically all charts have the same purpose, namely to perform technical analysis and make trading decisions. If we trade without relying on signals from the charts, then we will most likely cross some very important points, such as support and resistance lines. However, with line charts we can catch these signals, so that we can predict price movements, trend changes, closing prices, etc., all of which will be filtered by line charts and displayed clearly. So we can conclude that the use of the Chart Line is to make trading decisions as accurately as possible, looking at the support, resistance and closing price lines.

2. How to Identify Support and Resistance levels using Line Charts (Demonstrate with screenshots)

Support and resistance is one of the most widely used levels or signals. Simply put, it means a certain area that has gone up or down over a certain period. Some define support and resistance on a specific line, while others describe support and resistance over a wide area over a specific period.
"Support" is a market level that supports the market from falling. Usually bought above this market level. At a favorable market level, buyers will try to buy more, and sellers will be reluctant to sell, so demand will increase and the market will rise.
On the other hand, "resistance" is a market zone that limits the upward movement of the asset market. Resistance generally means lower buyers and higher sellers, ultimately lowering the market.
When a trend breaks through support or resistance, the market moves in a certain direction, creating new support and resistance.
In the chart below, I have identified the support levels on the line chart. When the price breaks the resistance level, the support and resistance levels will automatically be updated as shown in the chart below. As usual, to identify support and resistance levels we only need to connect the previous swing high and swing low with a horizontal line.
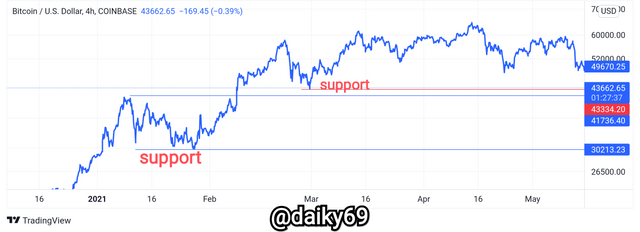
And below are the resistance levels that we can identify on the line chart. We only need to pay attention to the previous swing high, then draw a line horizontally to the future as a reference.
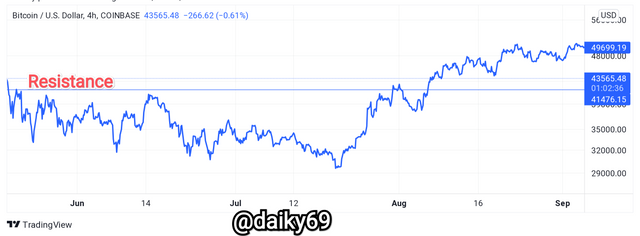

3. Differentiate between line charts and Candlestick charts.( Demonstrate with screenshots)

A line chart is a very simple type of graph. The single line represents the closing price for each day. Data is shown at the bottom of the chart and prices are shown along the margins. The power of line charts lies in their simplicity. It provides a concise and easy-to-understand overview of the price of a security over a given period of time.
Candlestick charts display the open, high, low, and close prices in a format similar to modern bar charts. Candlesticks can have different colors (blue/red, white/black) but the idea is always the same. So that we can see the interaction between buyers and sellers in the market, besides that we can also see buying, selling pressure, and also a lot of other information.
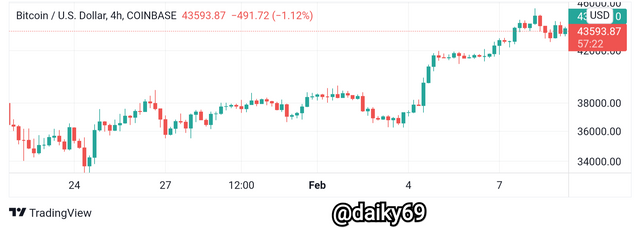
So we can conclude that, the difference between Candlesticks and line charts has a very big difference. But for beginners, line charts are the right choice because they are easy to understand and also remove noise from signals that are not really needed. While candlesticks have a bit of a hassle for beginners because there is a lot to consider before making a decision.

4. Explain the other Suitable indicators that can be used with Line charts.(Demonstrate with screenshots)

There are many indicators that we can combine with a line chart, including the RSI, MA, and EMA. And we can use all the indicators, depending on the needs of each trader. For example, consider the graph below.
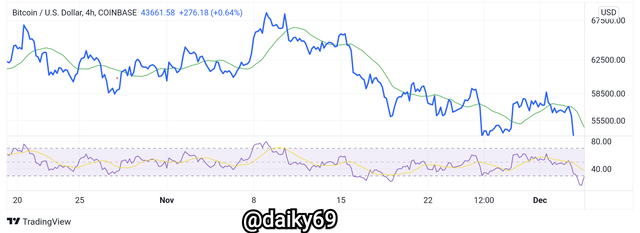
Here I have combined the RSI and MA on the line chart, and we can see that the line chart is almost 100% the same as the RSI line. So in my opinion, RSI and MA are very good choices to combine with line charts.
To predict an uptrend with the RSI or MA, we only need to look at price movements. If the price breaks above the MA line, then this indicates an uptrend and vice versa. While the MA line can be a dynamic resistance level in a downtrend market and a dynamic support level in an uptrend market.
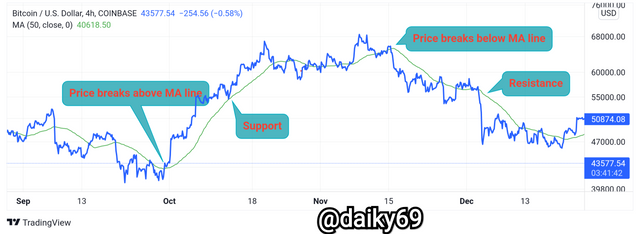
To see a trend reversal, we only need to wait for the price to break the MA line, if the price breaks above the MA line then this indicates an uptrend will occur. And if the price breaks below the MA line, then this indicates a downtrend will occur.

5. Prove your Understanding of Bullish and Bearish Trading opportunities using Line charts. (Demonstrate with screenshots)

As explained by professor @dilchamo that one method or way to identify trends is the use of Ascending and Descending Triangles. But we can also easily identify the trend with the MA or RSI indicators, I will explain how to trade using bullish and bearish signals with the MA indicator on the line chart.
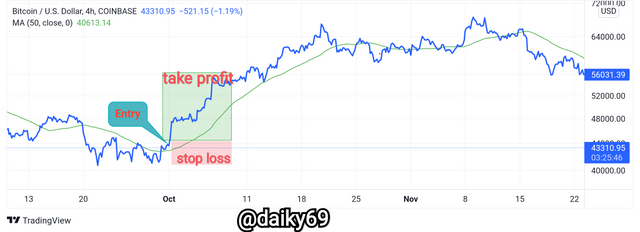
As mentioned above, for a bullish trend, the price must break above the MA line, when the price has penetrated the MA line we can immediately place a buy order. We can use the MA line as a dynamic support level, so we can place a stop loss below it. Use a wise risk ratio in placing take profit, this can be 1:1, 1:2, or 1:3.
As a real example, look at the graph below. I identify a trend reversal will occur after the price breaks above the MA line. I immediately place a buy order, I use a 1:3 risk ratio in determining take profit. I place my stop loss below the MA line.
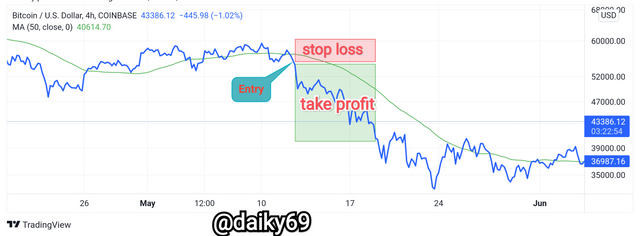
As for the bearish trend, we have to make sure that the price has broken below the MA line. After that we can immediately place an entry, now the MA line will serve as a dynamic resistance level so we will place a stop loss above the MA line. To take profit, we can use a risk ratio of 1:1, 1:2, or 1:3 this depends on the trader's willingness.
In the chart below, we can identify a trend reversal after the price broke below the MA line. We can immediately place an entry there, then do take profit and stop loss. In this example, I again use a 1:3 risk ratio.

6. Investigate the Advantages and Disadvantages of Line charts according to your Knowledge.

Advantages of Line Chart:
Line charts are easy to use and understand for everyone, new users will have no problem.
The line chart only relates the closing price over time, this means it removes the noise from price fluctuations so that it can be more easily visualized in making trading decisions.
The Line chart display is very simple because it only displays one line, this is certainly a plus for some people.
Support and resistance levels are also very easy to identify on the line chart. This is of course because the line chart only takes data on closing prices, so opening points, etc. are not displayed.
Disadvantages of Line Chart:
Professional traders may prefer candlesticks or other charts because line charts are too simple and simplistic and the signals offered are too shallow for some professional traders.
For some traders, data such as the opening, closing, high and low prices are important. However, we will not get all of that on the line chart, behind the convenience with a very simple appearance, it is also a weakness for the line chart.
Line charts are also not recommended for intraday or lower timeframe traders as they tend to generate invalid signals. Line charts are more suitable for long-term trading.
NOTE: All image sources are from TradingView

Conclusion

In general, line charts are simpler and easier to understand than other charts. Because the line chart only uses closing prices, there are other important signals that the line chart might miss. Line charts smooth and filter noise from price fluctuations, also we can easily identify support and resistance levels.
Charts can also be easily combined with other indicators, but line charts are not suitable for all types of trading. And also signals that are too simple make traders miss important points while trying to make trading decisions. Line charts are the same as other charts, there are advantages and disadvantages that surround this chart.
no cabe duda que esto es un tema complejo para quien no lo maneja, tu calificación esta bien, así que te felicito por tu logro.
Downvoting a post can decrease pending rewards and make it less visible. Common reasons:
Submit
Muchas gracias
Downvoting a post can decrease pending rewards and make it less visible. Common reasons:
Submit