
In this post, I will publish the homework from professor @kouba01 that I have completed as best as I can.

1. Discuss your understanding of the principle of linear regression and its use as a trading indicator and show how it is calculated?

Regression linear is a statistical analysis tool used to predict future values from available data. With regard to securities, this tool serves to identify situations when the price of a security is overvalued or undervalued.
Regression linear trend line is a straight line on a price chart, which is plotted using the least squares method so that price deviations from it are minimal.
Regression analysis is a set of statistical techniques to evaluate the relationship between variables. It can be used to assess the degree of association between variables and to model future dependencies. In fact, the regression method shows how changes in the "independent variable" can be used to capture changes in the "bound variable". This will determine the outcome variable in each situation.
The dependent variable in business is called a predictor (a characteristic that is observed to change). This can be sales, risk, pricing, performance, and so on. The independent variable is a variable that can explain the behavior of the above factors.
Regression linear is the process of drawing an exact straight line, i.e. finding optimal A (slope) and B (y-intercept). Where X represents time and Y represents value. This is what predictors are looking for, in addition to predicting trends and knowing the effect of a variable on the market using regression linear indicators.
This technique or regression linear indicator also allows to identify the overbought and oversold points of a financial instrument. This allows the trader to determine entry, exit, etc. So we can conclude that this is a very useful indicator and has many benefits, because the regression linear indicator is based on price and time as a chart measurement parameter.
The formula or calculation of the regression linear indicator is:
Y = a + bX
Where:
Y - dependent variable
X - is the time independent variable
a - is the intercept between price and time = 0
b - is the slope. It shows the behavior of the curve (decrease or increase, angle between axes)
A and B are called regression linear coefficients. Finding them is the main task. There are many ways to determine the coefficients of a and b. But the simplest and most reliable is the least squares method (it can be scientifically proven that this is the best way).
For example, let's say that X is 25 with the slope of b being 4.5. And a has no value or = 0. Then the formula is as follows:
Y = a + bX
Y = 0 + 4,5×25
Y = 0 + 112,5
Y = 112,5

2. Show how to add the indicator to the graph, How to configure the linear regression indicator and is it advisable to change its default settings? (Screenshot required)

To add a linear regression indicator, then we have to visit the site TradingView.
- Go to TradingView.
- Then click charts.
- then click on the indicator.
- In the search field, type Regression.
- After that add the indicators.
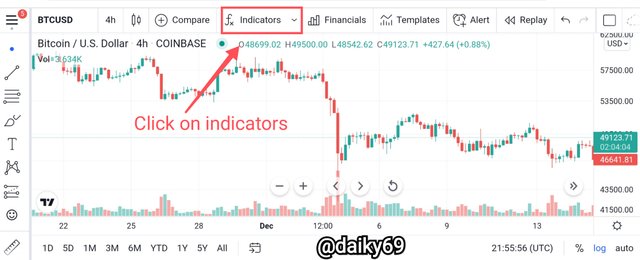
Step 1: click on the indicator, as seen in the image above.
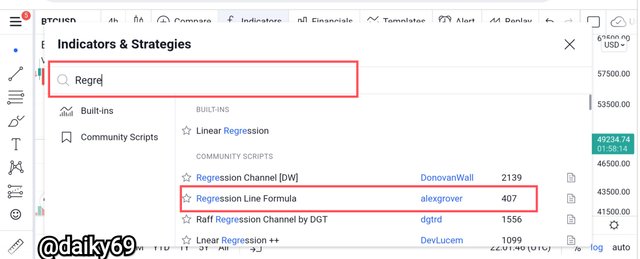
Step 2: Several indicator options will appear, to find the indicator we want, we have to write regression in the search column, then click add indicator regression line formula from alexgrover.
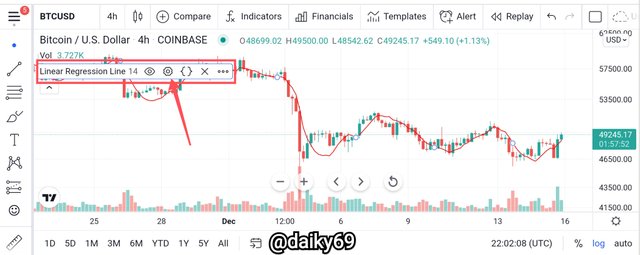
Step 3: to configure the indicator, then select settings.
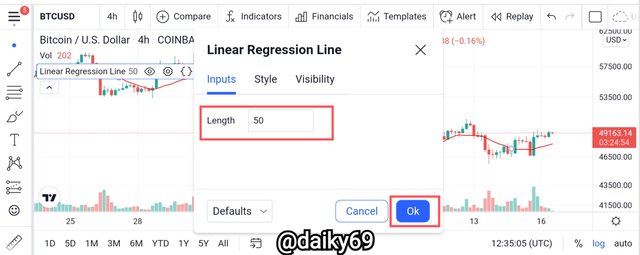
Step 4: here we can determine the indicator period according to our wishes, for example I choose 50 periods.
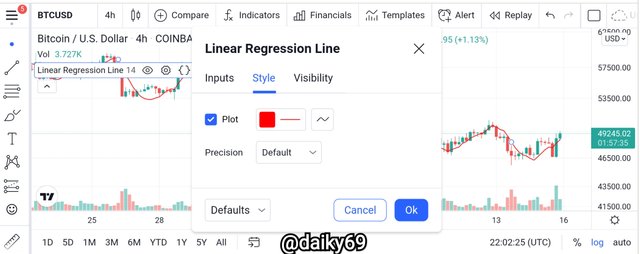
We can also specify the color of the regression line as we wish, the default color is set to red.
The default setting of this indicator is 14 periods, but we can adjust it according to the wishes and needs of traders. Please note that every trader uses indicator settings based on their needs in conducting analysis, in this case it depends on what strategy you use in the market.
The default settings look a little sensitive to the signal generated, there are even some fake signals that we can detect. I tried to set it to 50 periods and 66 periods based on the recommendations I read in several articles, and the results were pretty good because the signals generated were not too many and more accurate than the default settings.
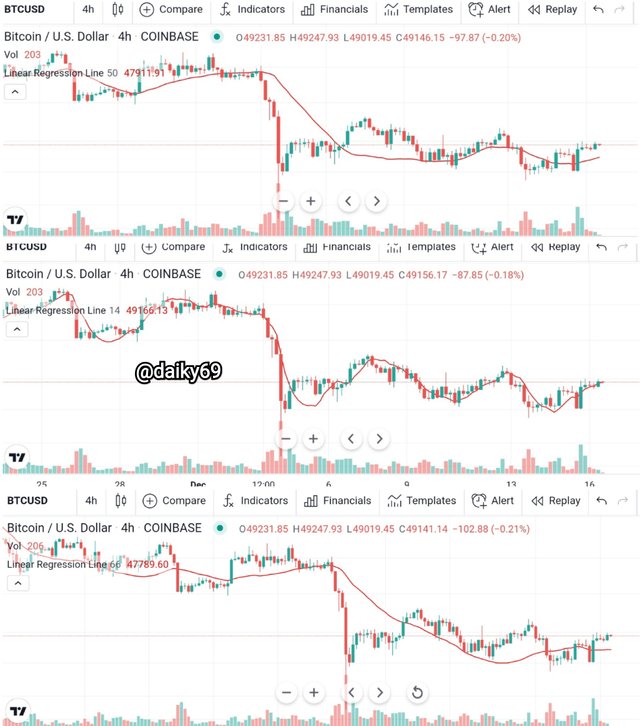
Here I have combined the three periods, namely 14, 50, and 66. From this we can see that the signals given by periods 50 and 60 are not as sensitive as those given by the default settings, so we can detect buy and sell signals clearly. For more details, take a look at the image below.
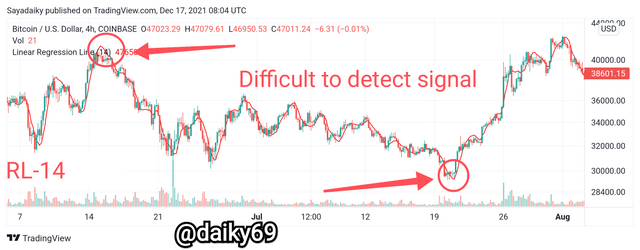
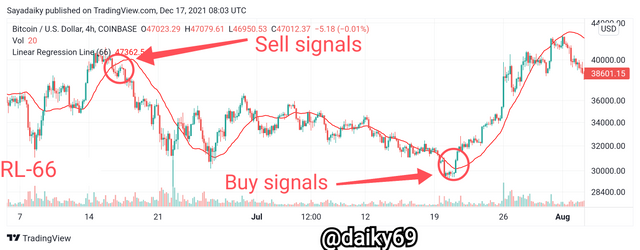
From the two images above we can distinguish several things: the default setting (14) gives a very sensitive signal and the line is very close to the candle so it is very difficult to detect buy and sell signals. While settings 66 and 50 look very clear to give buy and sell signals, the LR1 line looks further away from the candle so it's easy to detect signals.

3. How does this indicator allow us to highlight the direction of a trend and identify any signs of a change in the trend itself? (Screenshot required)

Actually, this is a very simple and simple indicator if we look at it from the outside, but it is very complicated to explain. How to highlight the direction of the trend with the LRl indicator is actually almost the same as the Bollinger bands and MA indicators.
Highlighting the trend
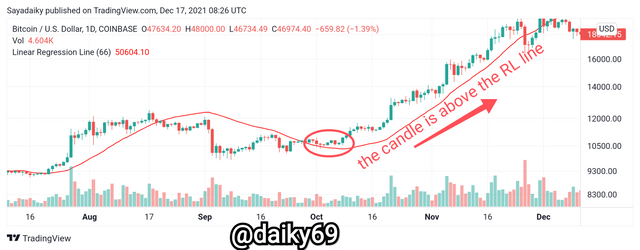
We can conclude that it is an uptrend when the candle is above the LR1 line and the LR1 line will look upward sloping. In the example above, it can be seen that all the candles are above the LRl line, then the LRl line is also rising or sloping upwards which indicates that it is a clear uptrend.
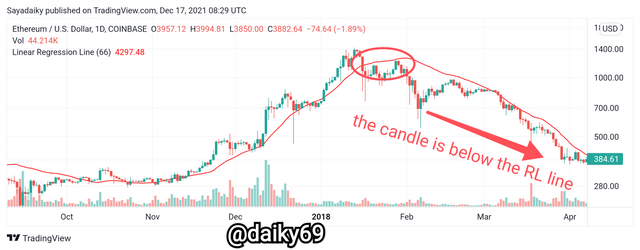
And vice versa, when the candle is below the RL line and then followed by the slope of the LR1 line from top to bottom, then it is a clear signal that the market is in a downtrend.
It can simply be concluded that, an uptrend can be confirmed when the candle is above an upward sloping line. And the downtrend can be confirmed when the candle is below the downward sloping LR1 line. So that's how we highlight the trend using this indicator.
Identify trend reversal
If we pay close attention to the two screenshots above, we may immediately understand that to identify a trend reversal we must pay attention to the weakening of the trend.
Because when a trend reversal will occur, the trend that occurred first will start to weaken, this can be confirmed by the LR1 indicator with prices starting to react around the LR1 line, to make it clearer, take a look at the picture below.
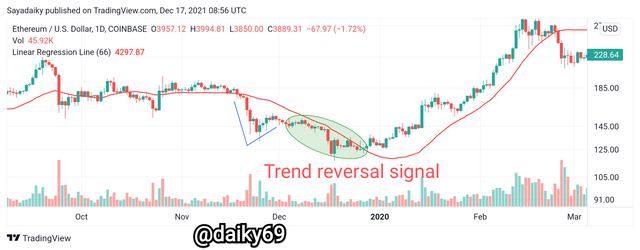
The market is consolidating very clearly with the candles around the LR1 line, the line looks very straight with the candles crossing up and down. Then there was a downtrend but it didn't last long because the reversal signal was clearly visible on the indicator.
A reversal signal can be confirmed when the trend starts to weaken with a candle starting to touch the LR1 line, when the line starts to look sloping upwards followed by a candlestick/price crossing from bottom to top that closes higher than the previous period/candle then it can be confirmed this is a reversal signal.
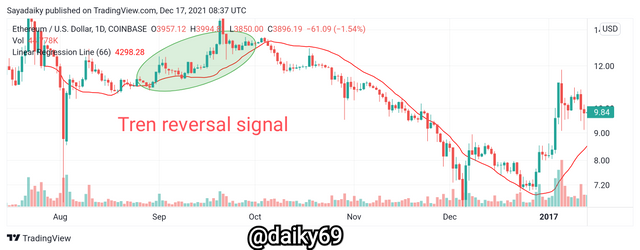
This applies to both bearish and bullish trends, trend reversal points always occur after the weakness of the previous trend, so to highlight trend reversals we must highlight trend weakness first which can be confirmed by the price being around the line with occasional crossings. When the line starts to slant with the candle crossing the line up or down with a closing price that is higher or lower than the previous period, this is a trend reversal signal from the LR1 indicator.

4. Based on the use of price crossing strategy with the indicator, how can one predict whether the trend will be bullish or bearish (screenshot required)

We have explained earlier that when the candle is above the line, this is a bullish trend. On the other hand, when the candle is below the indicator line, this is a bearish trend. But of course we will have difficulty predicting the trend if we do not know the signal from this indicator.
The bullish trend can be identified by several points. First the candle must have crossed/up above the indicator line, and the second the first candle that crossed the LR1 line must close higher than the previous period. The body of the candle will also look bigger and longer. If we see something like this, it can be confirmed that it is an early signal of an uptrend.
To identify a bearish trend, several points must also be met. First the candle must cross or fall below the LRl line, then the closing price of the candle that crosses below the LRl line must close lower than the previous period, this is the opposite of how to predict a bullish trend.
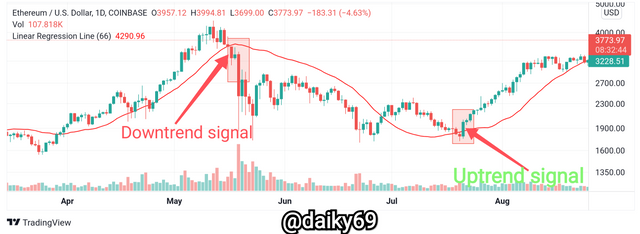
From the chart above, we can see that bullish and bearish signals are clearly identified. On a bearish signal we can see that the candle fell below the LRl line, the first candle that fell below the LR1 line closed lower than the previous period with a fairly large and long real body.
Then on the second signal, which is a bullish signal, it can be seen that the candle crossed again above the LR1 line which closed higher than the previous period, also with a large and long real body.

5. Explain how the moving average indicator helps strengthen the signals determined by the linear regression indicator. (screenshot required)

As I mentioned at the beginning of the post, LRI has similarities to the MA indicator. The MA indicator is used to identify the trend and its reversal, the same applies to the LRI indicator. However, LRI has a higher correlation with price tracking, so combining these two indicators is great for minimizing false signals and also confirming bullish and bearish signals.
It also depends on the configuration we set on both indicators to get the perfect result. In this example I will use a setting of 66 on the LRI indicator and 20 on the MA indicator. With this setting, I can confirm the signal in these two indicators, whether it is a fake signal or a real signal.
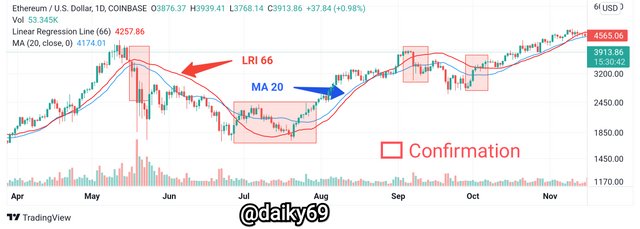
In this chart, we can confirm the signals of both indicators. There are four points that have been marked on the chart, at the first point it can be seen that the MA and LRI lines run side by side until the candle crosses downwards on these two indicators. This can be confirmed as a sell, in which case both indicators confirm a sell signal.
Meanwhile, at the second point, it looks a little different. Where the MA indicator gives an invalid signal, after the candle crosses above the MA line, the candle suddenly drops back below the MA line which is a sell signal. However, the LRI indicator does not give the same signal as the MA, the sell signal on the MA indicator is not confirmed by the LRI which is proven to be true, because after that the price experienced an uptrend.
At the last two points, both indicators give the same confirming signal. With the two indicator lines running close to each other, there is also a candle that is clearly visible at the intersection of the two indicator lines.

6. Do you see the effectiveness of using the linear regression indicator in the style of CFD trading? Show the main differences between this indicator and the TSF indicator (screenshot required)

CFD trading gives traders and investors the opportunity to speculate on the price movement of an asset without actually owning the underlying asset itself. Unlike traditional investing, CFD trading allows traders to play short as well. Since, in the case of CFDs, the investor does not actually own the asset, he can sell the asset and make a profit when the price goes down, or lose when the price goes up. So it is very necessary indicators that are truly accurate in providing signals, with LRI we can identify trends in the market to place our operations in the market.
On the other hand, traders can also use the proven TFS indicator as a trend hunting indicator. The Time Series Forecast indicator is used in a similar way to linear regression to determine trends over a period of time. On the chart, the indicator looks like a curved line consisting of the last points of several linear regression trend lines.
The TSF can be used to predict future prices in the market as it determines the slope of the trend (up or down) and predicts future movements. For example, if the price is moving up, the TSF tries to determine the slope of the trend, compares it to the current price, and passes this calculation on to future periods. If the trend continues, the value of the time series forecast indicator is the price forecast for the future period. If the candle is above the TFS line then this is called an uptrend and vice versa, this is the same as linear regression and moving average.
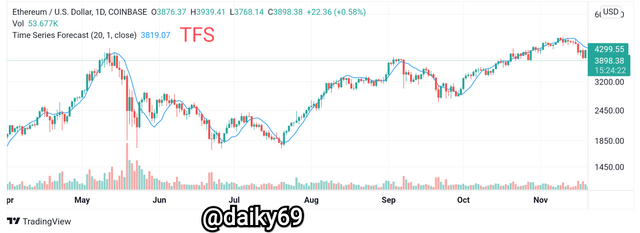
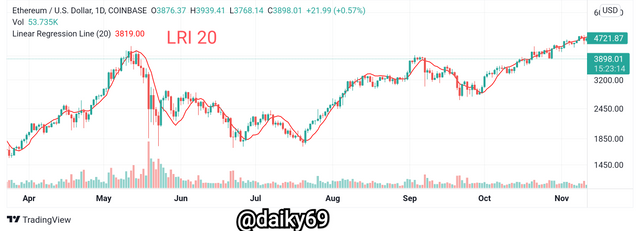
It can be seen in the two graphs above, that the TFS and LRI lines run very simultaneously with the same period of 20. There is almost no significant difference between these two indicators, even all the signals generated are the same and well confirmed on both indicators.
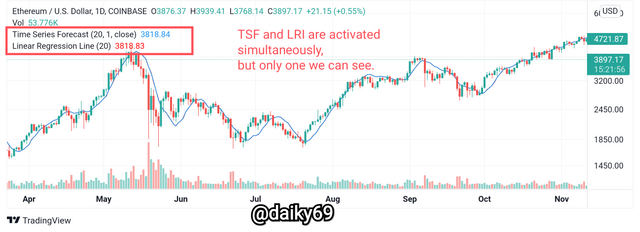
However, it should be noted that the TFS indicator is indeed very good to use in the short-term period. While LRI is better used for a longer period to get a clearer signal. Indeed, there is no significant difference if we have a shorter period on both Indicators, but with a longer period there will be a very significant difference.
So we can conclude that, the main difference between these two indicators is the time period that we set. Another difference between these two indicators is: TFS is an indicator of strappolation, while LRI is intrapolated.

7. List the advantages and disadvantages of the linear regression indicator:

Advantages:
The most significant advantage is the construction of a clear channel with certain parameters. At the same time, the indicator does not send unnecessary information at all, which greatly facilitates the transaction settlement process.
With all its functions, the indicator always produces identical and stable results. This is very important for opening trades that are known to be profitable.
Regression linear allows us to quickly and accurately determine the direction of market movement, because the indicator is very simple and easy to use.
This indicator also reacts quickly to asset price action, thus producing signals that are more accurate than moving averages.
Disadvantages:
The LRI indicator can confirm signals and trends, but it is not recommended to be used independently so we have to combine it with other indicators.
The indicator rebuilds the value and forms the chart after the next closed bar. This can be a loss for some traders, especially for short-term trades. It is necessary to properly understand the data generated by the instrument.
LRI shows a trend signal which is slightly lagging behind the current market situation.
The LRI indicator is not good for use in highly volatile markets because it will send a lot of false signals that will make traders fail.

Conclusion
The regression linear indicator is a convenient tool that greatly facilitates the work of the modern trader. It can be used in almost any graph, and doesn't have to be singular. Professional traders often use complex modifications that allow them to change settings more flexibly, according to the wishes of the user.
LRI signals are reliable and accurate and, when used properly, can be an important part of a trading strategy. It is important to understand well how and for what purpose this tool is used and not to try to accept regression as an ordinary average construct.
Setting the period is also very influential on the signal generated, the default period is possible to use but we will have difficulty detecting reversal signals and also confirming the trend. So use a longer period, and adjust it to your needs.