In this post I will publish the results of my work in completing homework from professor @fredquantum. Please correct me if there is a discussion that is wrong or confuses you.

1. In your own words, explain your understanding of On-Balance Volume (OBV) Indicator.
On Balance Volume is a trend indicator which is calculated based on trading volume data (Volume). It is an indicator that is in sync with the price. OBV is one of the simplest and at the same time effective indicators. It was introduced by Joseph Granville in his 1963 book A New Stock Market Strategy, but remains relevant today.
The OBV indicator is calculated by adding volume, if the closing price of the current period is higher than the previous one, the volume of candles is added to the value of the Balance Volume indicator. If the current closing price is lower than the previous one, the volume data is subtracted from the indicator. If the current price is equal to the previous price, the OBV indicator will not change. OBV analyzes the price of an asset as a dotted line, which shows its change whether the current trend is confirmed by trading volume or not.
The indicator is based on the theory that volume fluctuations occur before price movements. Granville explains this theory by the fact that prices may not fluctuate due to sharp increases or decreases in trading volume. Simple graphics But such an event will soon result in a strong move. This is because large-scale investors have started investing. Cash is invested in assets and small investors are still selling.
In this case, the volume increases significantly without significant changes in the price movement. However, after a while, the purchases outweighed the sales, and the price went up. Over time, big investors decide to sell their assets, and the opposite happens. For maximum profit, you need to catch this wave and buy at the lowest price and sell at the highest price.
As such, the OBV indicator takes this theory into account and is actually a major trend reversal indicator. When the indicator lines are getting bigger and the price is rising on the chart, it indicates a large volume and confirms an uptrend. In this case, an increase in price will occur as a result of an increase in demand for this asset, which is a prerequisite for a strong upward trend. Divergence occurs when the price goes up and the OBV indicator goes down. This indicates weakness in the uptrend and a possible reversal in the near term. For a downtrend, the OBV indicator is interpreted the other way around.
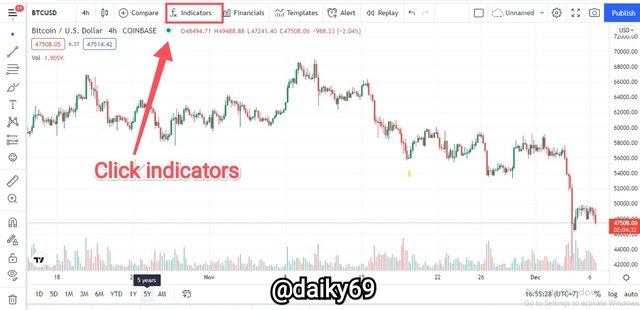
2. Using any charting platform of choice, add On-Balance Volume on the crypto chart. (Screenshots required).
Just like adding indicators in general, we just need to go to TradingView and click on the chart so that we are directly directed to the chart.
- Then click on the indicator.
- Type "OBV" in the search field.
- Lastly, add.
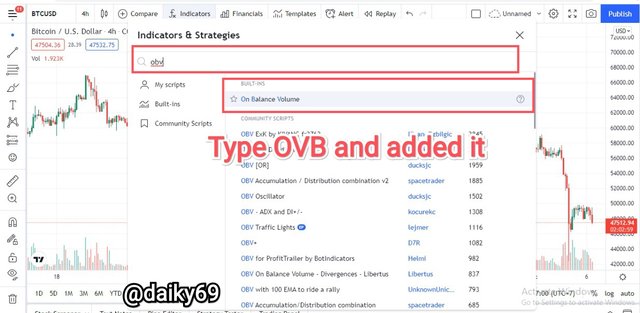
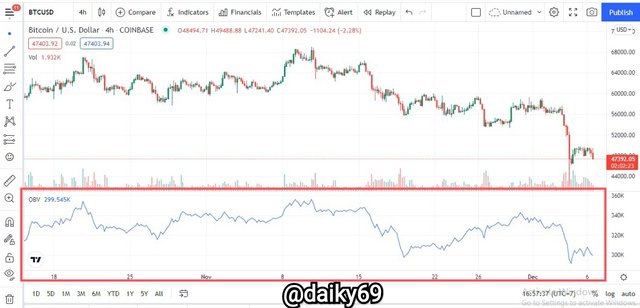
- The indicator has been successfully added, we can also set the time on the OBV, so we can use the time of 1 minute onwards.
3. What are the Formulas and Rules for calculating On-Balance Indicator? Give an illustrative example.
On-balance volume is what is called a cumulative indicator. When the price goes up, it adds volume, and when the price goes down, the volume decreases. Thus, the indicator will be calculated as follows:
- If today's price is higher than yesterday's price:
OBV = OBV (previous) + today's volume. - When both prices are the same (yesterday's close and today's close):
OBV = OBV (previous) + 0. - When today's closing price is less than yesterday's price:
OBV = OBV (previous) - today's volume.
The indicator can be positive or negative, fluctuate around the zero line, as well as between positive and negative values. OBV will be positive if today's price is higher than the previous close, and negative value will be displayed if today's price is lower than the last close.
How does this indicator do the multiplication, for example the price of steem the day closed at $0.7 with a volume of 40, while the previous day the price of steem was closed at $0.65 with a volume of 35. That means the current volume is higher than before, then the formula is OBV = Volume (previous) + current price: OBV = 35 + 40 = 75.
Or let's say today's steem volume is 35 and the previous volume is 40, which means today's volume is higher than the previous period, then the formula is OBV=Volume (previous) - current price: OBV = 40 - 35 = 5.
Or it could be that today's steem volume is the same as the previous day's 45, so the formula is OBV= Volume (previous) + 0: OBV= 45+ 0 = 45.
4. What is Trend Confirmation using On-Balance Volume Indicator? Show it on the crypto charts in both bullish and bearish directions. (Screenshots required).
The growth of the OBV line indicates that volume was higher during the period of growth. If the price also rises, then the OBV is considered to confirm the uptrend, because the price increase in this case is the result of an increase in demand, the opposite is also true for the downtrend. With this, OBV will confirm a strong trend if the oscillator moves in the same direction as the price. OBV will confirm the trend by forming higher and lower highs and lows than the previous period's low, or lower highs and lower lows that are lower than the previous low.
If the price chart is growing significantly faster than the OBV, this means that the movement is due not so much to an increase in demand but rather to a lack of supply. Part of this trend is not confirmed by an increase in volume, and there is reason to believe that the price may quickly return to its previous value.
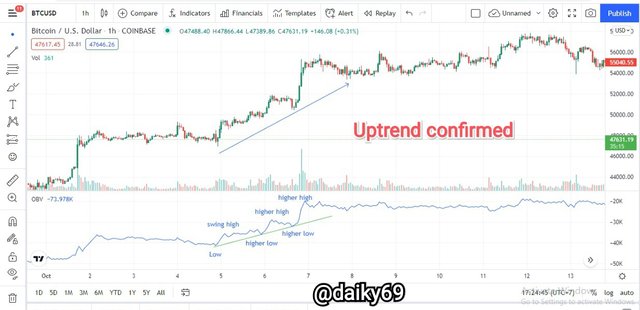
In the chart above we can see that OBV has confirmed a strong trend by forming higher highs and lows from the previous period. This is a very clear and accurate confirmation signal so it is certain that a strong trend will prevail.
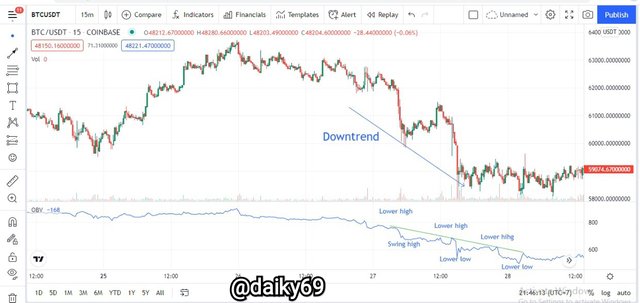
Likewise, with the confirmation of the bearish trend, OBV will form lower highs and lower lows. In the chart above I have marked downtrend confirmation using OBV, which is clearly visible that the indicator lines are forming lower highs and lower lows, respectively.
5. What's your understanding of Breakout Confirmation with On-Balance Volume Indicator? Show it on crypto charts, both bullish and bearish breakouts (Screenshots required).
Breakout is a very important signal to know because we can determine entry and exit positions, breakouts occur in a consolidation market. With OBV we can detect it because the OBV oscillator will increase as volume increases, the oscillator will break the previous high or resistance line to mark a breakout. Maybe this is a simple feature that we can find in all indicators, but it is important because we can determine entry and exit positions.
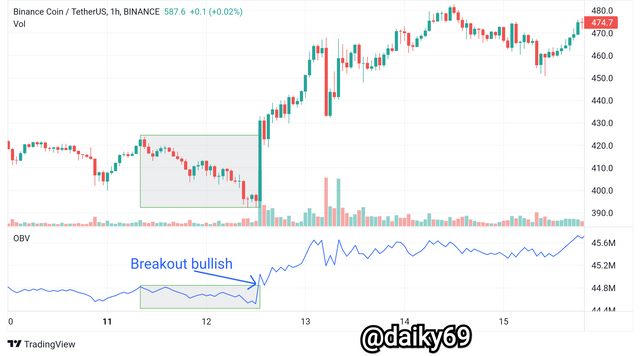
In this chart we can see that the market has been consolidating with an up and down movement between the support and resistance levels, but the price has never broken through the resistance levels. Then the price broke through the resistance level and was confirmed by the OBV with the oscillator line rising above the resistance line.
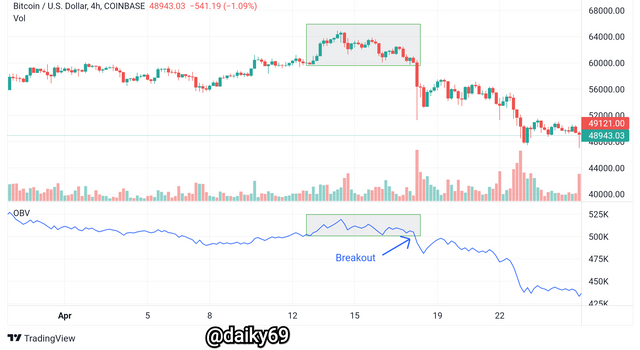
The opposite is true for a bearish breakout, where the support line is broken down by the price then the OBV oscillator also follows it to confirm the breakout. Look at the chart above, the price has broken the support line which was the previous low. Then OBV also goes hand in hand with the price, which is dropping down to confirm a breakout.
6. Explain Advanced Breakout with On-Balance Volume Indicator. Show it on crypto charts for both bullish and bearish. (Screenshots required).
Advanced breakout is a signal that we can find on OBV, basically it is almost like a divergence signal, but wait a minute because there is a slight difference here.
We can detect advanced breakouts by paying attention to the OBV oscillator, when the price tries to break through the previous high but fails but the OBV oscillator confirms that the previous high has been broken then this is a bullish breakout signal that we can use to open long positions.
The opposite applies to a bearish breakout signal, the price tries to break through to the previous low but fails, and the OBV oscillator confirms that the previous low has been broken then this is a bullish breakout signal.
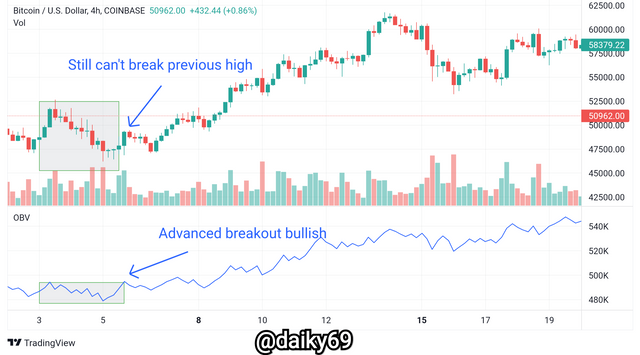
Take for example in the chart above, the market is in a period of consolidation. The price continued to try to break the previous high but failed, but the OBV oscillator confirmed that the previous high had been broken. What happens next, namely the market enters a bullish trend, this is the right period for us to place a buy order.
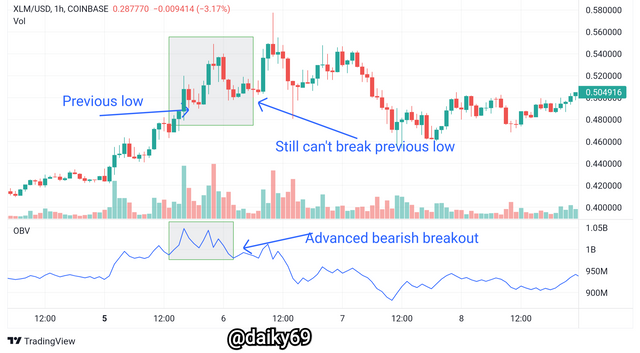
For an example of an advanced bearish breakout you can see in the image above. The market is rising but the OBV does not confirm that there will be a strong trend, in fact the opposite is happening, namely the OBV oscillator confirms a bearish breakout. The rising price then stopped forming a higher low, the price then tried to break the higher low but failed, but OBV confirmed that the higher low had been broken, which is a bearish breakout signal.
7. Explain Bullish Divergence and Bearish Divergence with On-Balance Volume Indicator. Show both on charts. (Screenshots required).
Another plus of this indicator is that we can find divergence signals, namely trend reversals. The way this indicator detects bullish and bearish divergence signals is very similar to some other indicators, call it the RSI, etc.
A bullish divergence signal can be identified and confirmed if the price continues to climb and makes a new higher high but the OBV oscillator shows the opposite by forming a lower high. If we find this on the OBV indicator, then it is a good time for you to get out of the market and take your profits because that is what is called a bearish divergence.
A bullish divergence signal is the opposite of a bearish divergence signal, i.e. the price continues to form a lower low but the OBV shows a lower high which is contrary to what is happening in the market. To make it easier to understand these two divergence signals, I will give an example on a chart to make it easier to understand.
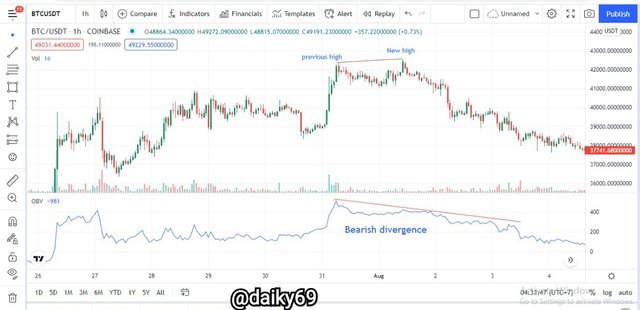
Look at the chart above, where the price has just formed a higher high from the previous high or we can say the price is a new high, but the indicators don't agree with the market situation. The proof is that the indicator has just formed a lower high instead of a higher high as happened on the chart. This is called a bearish divergence signal, so it is a good time for you to take profits.
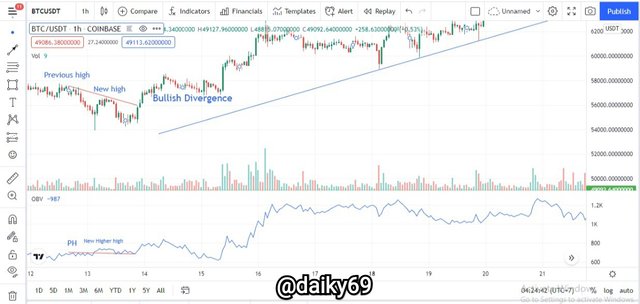
And in the chart above this is a bullish divergence signal, namely the price continues to form a lower low. However, OBV showed a higher low, not long after that the market immediately entered a bullish trend. If you find this in OBV, then it is a good time to enter the market and immediately place a buy order because it is called a bullish divergence signal.
- When the volume of a security or asset decreases without a concomitant drop in price, you can expect a price drop.
- When volume increases without an accompanying price increase, a price increase is expected.
8. Confirm a clear trend using the OBV indicator and combine another indicator of choice with it. Use the market structure to place at least two trades (one buy and one sell) through a demo account with proper trade management. (Screenshots required).
- Buy Trade
This time I will combine the OBV indicator with the Aroon indicator on the BLZ/USDT token. First I tried to detect a trend using OBV and confirmed it with the Aroon indicator. The BlZ price showed a decline in the previous few days but the OBV did not confirm it, instead the OBV oscillator seemed to increase which indicates the opposite, indeed the price then increased by creating a higher high and higher low line, this indicates a bullish trend. I tried to confirm the trend using the Aroon indicator, and it seems that the trend is quite strong because Aroon-Up is at the level of 85.71% and Aroon-Down is 14.29%.
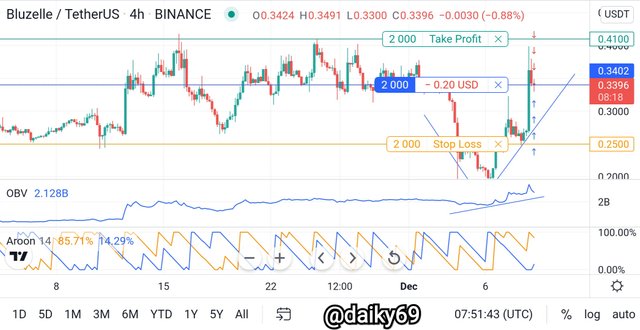
I started placing buy orders at the price right away, then placed stop loss at $0.25 and take profit at $0.41. Take profit and stop loss are equivalent to the resistance and support levels, i.e. the previous highs and lows.
- Sell Trade
This time I switched to LTC/USDT tokens, I detected a bearish trend in LTC tokens and for that I had to prove it through the OBV and Aroon indicators.
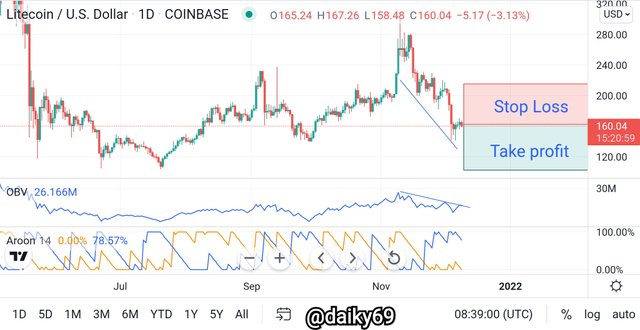
The OBV indicator has confirmed a bearish trend in LTC tokens, this is evidenced in the OBV oscillator which has declined following the LTC price and created a lower low and lower high line, even a few days earlier there had been a confirmed bearish breakout on OBV (the indicator has broken the previous low). Although LTC prices have not done so. Then I used the Aroon indicator to confirm the bearish trend, and as you can see that the bearish trend is very strong, namely Aroon-Down 78.57% and Aroon-Up 0%.
The current price of LTC is $160, I placed take profit at $140 and stop loss at $215.
9. What are the advantages and disadvantages of On-Balance Volume Indicator?
Advantages:
The calculation of the OBV indicator is very simple and easy to understand.
As a leading indicator, OBV can signal a potential breakout when prices move in consolidation.
On-balance volume can be used to confirm trend direction.
This can be used to find divergences.
Disadvantages:
A large spike in market activity during a trading day can cause a spike in indicator readings.
The same volume will be added or subtracted regardless of whether the price moves a few cents or a few dollars. Therefore, OBV does not take into account the rate of price movement.
Volume on the balance sheet does not include all the relevant data needed to analyze price movements.
There are still many false signals, so we have to be more careful in observing them.
Conclusion
The OBV indicator is an easy-to-use technical analysis tool that allows you to determine the direction of the current trend. However, as an independent tool for strategy building, it is of little use. Additional tools are required to confirm the signal