
Hi, I almost missed an amazing class due to my busy schedule these past few days, but I will try my best to do homework task from professor @allbert.

1. Explain in your own words what the A/D Indicator is and how and why it relates to volume. (Screenshots needed).

The A/D indicator is an indicator that falls into the accumulation category by using volume and price as a measure of whether a currency pair is accumulated or distributed. The accumulation/distribution steps attempt to determine the difference between a price and volume flow. It provides insight into how strong the trend is.
If the price of an asset goes up but the indicator goes down, then this indicates that the buying or accumulated volume may not be sufficient to support the price increase and may cause the price to fall (bearish). And conversely, if the A/D line moves up but the price of an asset goes down, this indicates that the downtrend will end soon and a trend reversal is occurring, which is bullish.
In addition to the divergence, the A/D line if it is able to provide us with trend confirmation, the way to find out is also quite simple. If the A/D line goes up, it can be confirmed as an uptrend. And if the A/D line goes down, it can be confirmed that this is a downtrend.
Accumulation occurs when buying pressure in the market strengthens due to the large number of buyers' requests to buy and HODL. While Distribution occurs when selling pressure in the market strengthens because people decide to let go rather than continue to do HODL.
Why A/D Indicators Relate to Volume
A/D indicators are cumulative, meaning the value of a period is added to or subtracted from the last. The A/D indicator measures supply and demand by looking at what period the price closed, then multiplying that number by the volume. It is because of this that the A/D indicator is closely related to volume and cannot be separated.

2. Through some platforms, show the process of how to place the A/D Indicator (Screenshots needed).

If we want to place the A/D indicator into the charts, we can use the charts provided by TradingView. In this case, I used the TradingView chart on CoinMarketCap.
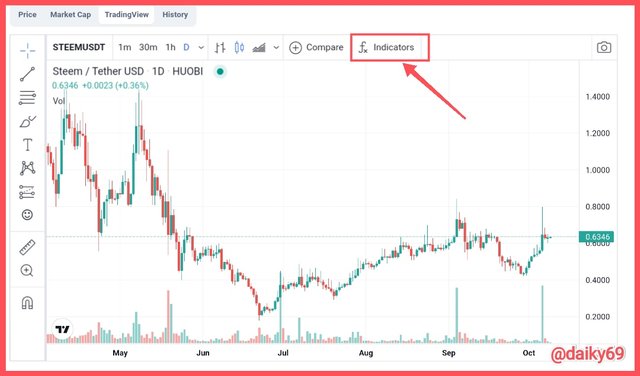
To add an A/D indicator, click on the "indicators" menu.
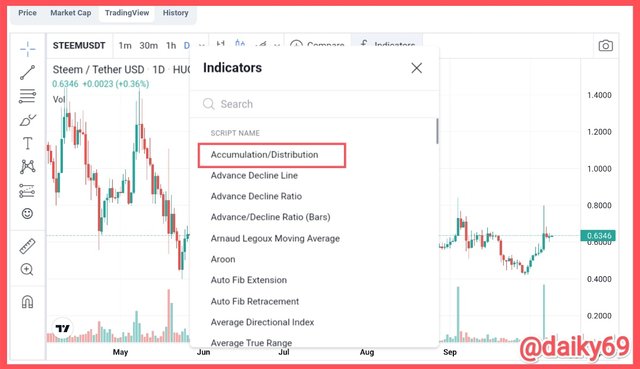
Since the A/D indicator is at the top, we just need to click on the indicator to add it to the charts. If your indicators menu does not display the Accumulation/Distribution indicator at the top, then just type the name of the indicator in the search bar.
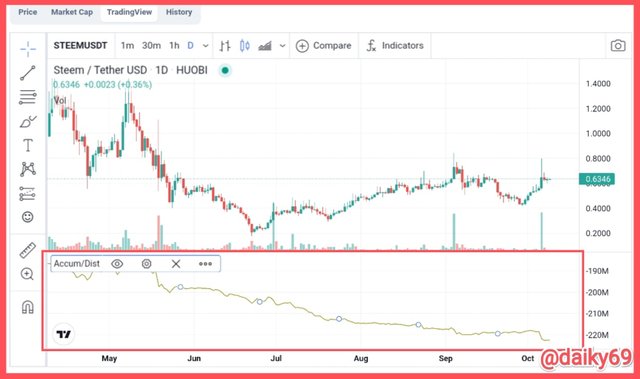
And the A/D indicator has been successfully added to the charts. That's how to place the A/D indicator into the charts.

3. Explain through an example the formula of the A/D Indicator. (Originality will be taken into account)

When calculating the indicator, a certain part of the volume of this candle is added or subtracted to the current accumulated value of the indicator. So, if the closing price of the candle is closer to the maximum price of the candle, then part of the volume will be added to the indicator value, and the closer it is to the maximum of the candle, the greater the added value will be. and conversely, if the closing price is closer to the minimum price, then part of the volume will be reduced, and if it is getting closer to the minimum it will be even greater in value. so, if the closing price is in the middle, i.e. between high and low, then the indicator value will not change.
The formula for the A/D indicator is as follows:
A/D = (A/D)-1 + MFV
MFV=MFM×VP
- A/D = Accumulation/Distribution
- (A/D)-1 = Previous Accumulation/Distribution
- MFV = Money Flow Volume
- MFM = Money Flow Multiplier
- VP = Volume Period
MFV value of MFV=MFM×VP
MFM value of= (C−L)−(H−C)/H-L
- (CLOSE price − LOW price)−(HIGH price − CLOSE price) / High price − Low price

4. How is it possible to detect and confirm a trend through the A/D indicator? (Screenshots needed)

With the A/D indicator we can detect bullish and bearish trends, not only that because the A/D indicator is also able to identify divergences.
The way to detect a bullish trend is to pay attention to the line of the A/D indicator, if the line of the A/D indicator goes up along with the rising price of the asset then this indicates market accumulation, ie buyers dominate the market and sellers try to compensate by supplying as much as they can. This is a way to detect and inform the bullish trend of the A/D Indicator.
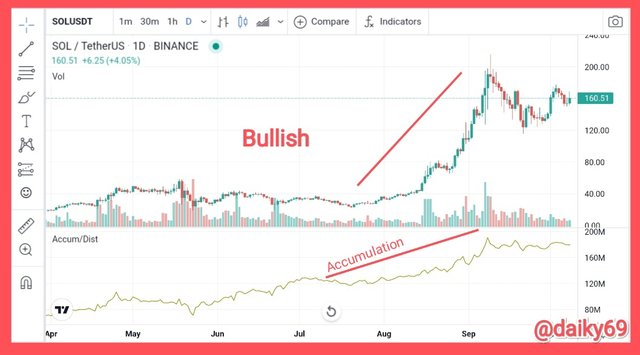
On the other hand, if the line of the A/D indicator goes down at the same time as the asset price falls, then this is clearly a distribution in which sellers dominate the market and buyers lose control of it. This is a way to detect and confirm a bearish trend.
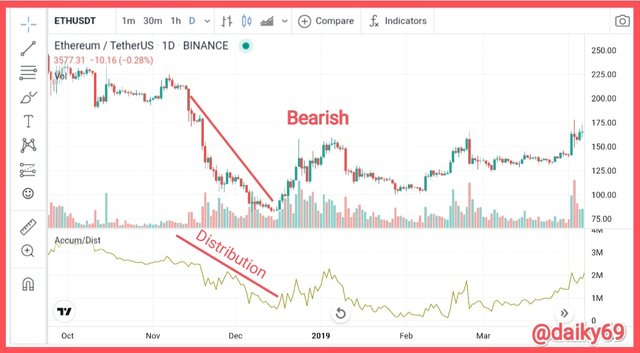
Meanwhile, to identify the divergence, we only need to pay attention to the line of the A/D indicator because the line will be against the price trend. If the price movement of the asset goes up and the A/D indicator line goes down and vice versa the price goes down the A/D line goes up, then this is a sign of divergence. This indicates that the current volume is not able to compensate and maintain the trend so that a price reversal will occur.
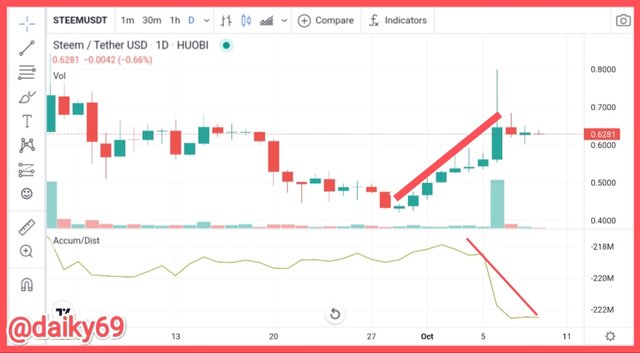
Not all signals given by indicators are correct, so it is a good idea to use several indicators at once when trying to analyze assets.

5. Through a DEMO account, perform one trading operation (BUY or SELL) using the A/D Indicator only. (Screenshots needed)

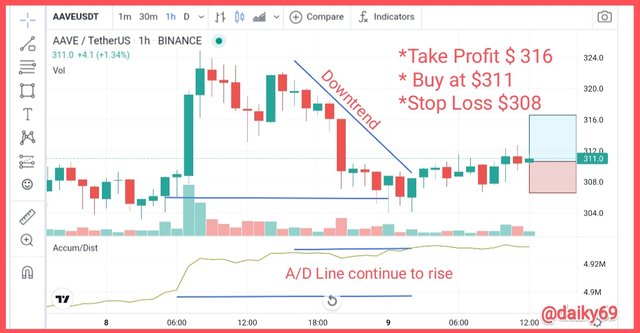
I used the AAVE/USDT pair to place buy orders using the A/D indicator lines. In the 1 hour chart AAVE/USDT above it can be seen that the A/D line detected a divergence, while the price was in a downtrend, the A/D line remained in line with the previous line, meaning that the price would return to an uptrend position.
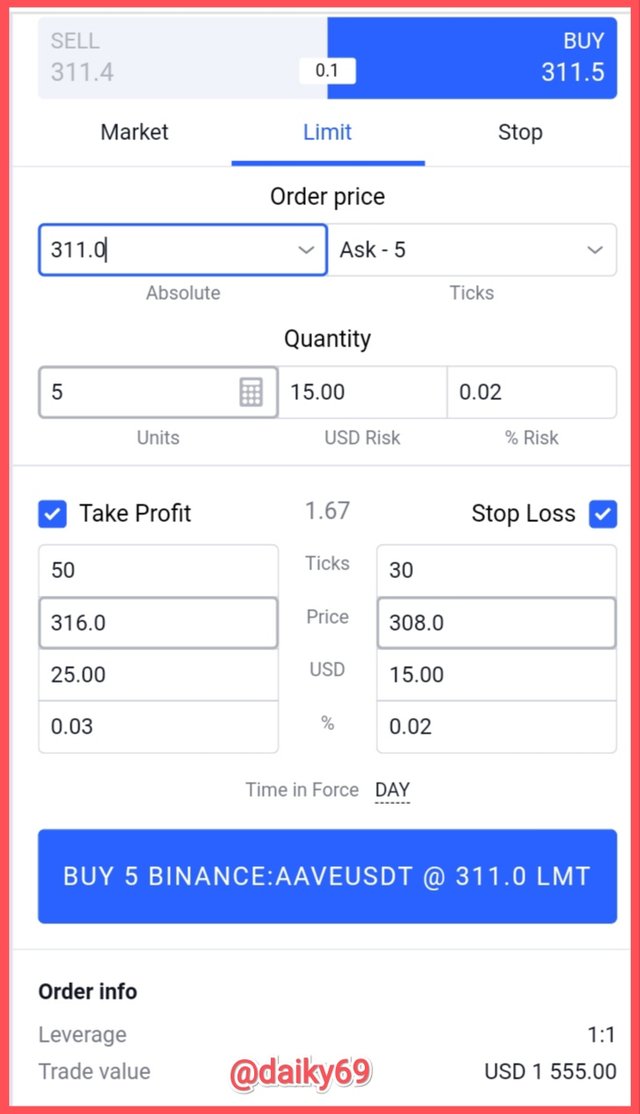
I went straight in at $311 without waiting for the breakout to happen, this is my omission. I should have put the buy price above $311 after the price broke the resistance line, but this was a technical glitch on my part and I didn't have time to change it again.
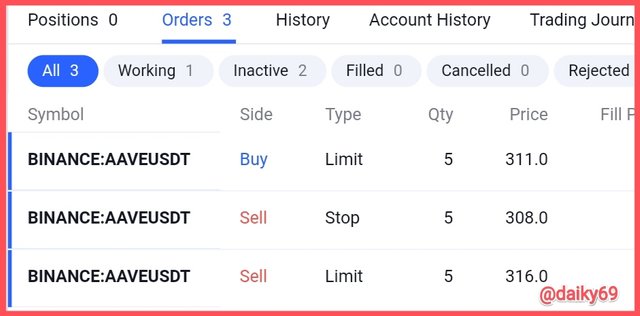
Then you can see, I entered at $311 and placed a stop loss at $308 with a take profit of $316, the risk management was almost 2:1.

6. What other indicator can be used in conjunction with the A/D Indicator. Justify, explain and test. (Screenshots needed).

Actually we can communicate the A/D indicator with a trend-following based indicator, this aims to predict the trend of the asset in the future and confirm it with the divergence signal given by the A/D indicators. In this case, we can use indicators Moving Average, Moving Average Convergence Divergence (MACD), Relative Strength Index (RSI), Bollinger Bandetc, in this case I prefer SMA to be consumed with the A/D indicator.
The Simple Moving Average indicator is an indicator that can be used to identify future prices for future periods in an asset. Thus, the SMA will give a signal if the price trend is going up or down through a cross between the lines or just one line, this is an indicator to predict the long term trend of the market.
Then we can make decisions for the trades we make using the A/D indicator, we can confirm the future trend with the A/D indicator also pay attention to the signals from the SMA indicator, if everything is the same then we can confirm and confirm the trend will occur.
Why is that, because by combining the A/D and SMA indicators we can identify divergences with the A/D indicators and detect trends with the SMA indicators. If these two indicators give the same signal, the A/D divergence will be bullish and the SMA indicator detects an uptrend will occur, then this indicates that the price will actually enter a bullish trend.
Let's try using a chart and see how these two indicators work together.
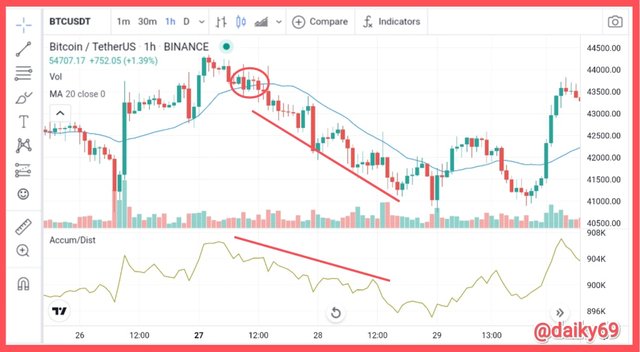
It can be seen in the screenshots above that both indicators give the same signal, the A/D indicator line shows that the market is in the distribution stage, while the SMA indicator line is above the asset price, which is a downtrend.
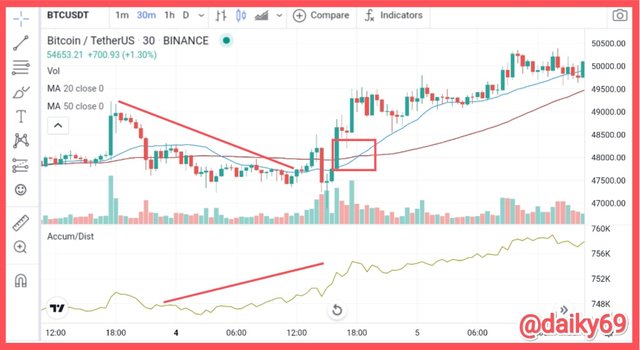
Next to the divergence, the A/D indicator detects that bullishness will occur because the line of the A/D indicator is opposite the price. Then the SMA indicator also gives a signal that the market will enter a bullish period with a line crossover or commonly called a golden cross, in this case I use two SMA lines, each of which I set in the 20 and 50 periods.
This is proof that these two indicators are able to work very well when combined together, something that traders must do because we cannot trade using only one indicator.

Conclusion

Accumulation/distribution indicator is a complex technical indicator that is very helpful in determining the significance of the current trend. Accumulation / Distribution line is based on trading volume data. By its nature, the accumulation/distribution line is an expanded version of the on-balance volume indicator, which makes the indicator very important enough to be included in we analytical toolbox.
I am grateful for the class given by professor @allbert, because this is really new science for me. I took the initiative to broaden my horizons on the A/D indicator by reading several articles and spending hours but I am quite satisfied because I have learned new knowledge.