
Hello Professor @allbert, I'm grateful for the opportunity to once again learn another strategy from you. I really enjoyed your lecture and analysis. Here's my homework, I hope you like it.

1- Define in your own words what a contractile diagonal is and why it is important to study it. Explain what happens in the market for this chart pattern to occur. (screenshot required / Bitcoin not allowed)
What Is Contractile Diagonal?

A contractile diagonal is a price pattern that indicates a trend reversal. Like the Elliot Waves theory, this pattern also consists of 5 waves that decrease as they increase. Thus, wave 1> wave 2>wave 3> wave 4> wave 5. After the fifth wave, there is a break in the pattern which results in a reversal of the current trend.
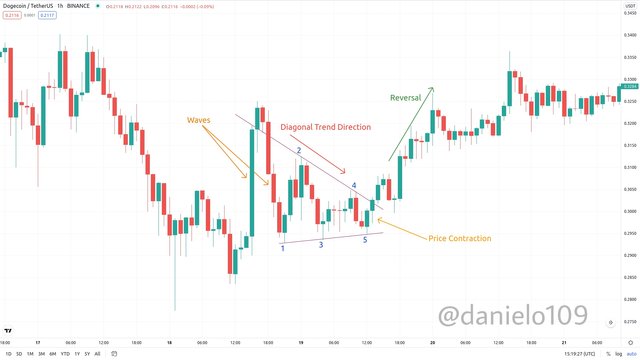
The pattern shows a contraction in price. I think the name came about because of its shape and contraction in price. You can easily identify this pattern by using trend lines to mark the highs and lows on the chart when there's a sign of contraction in the price movement. Connecting the highs and lows of a contractile diagonal also shows the formation of support and resistance. You'd notice the price of the asset moves within that range as it narrows with the increase in the number of waves.
Why it is important to study Contractile Diagonal
After studying contractile diagonals and how to work with them I've realized how important they are. Their main use is for identifying trend reversals. How to work with them depends on your strategy. They can also save you from making huge losses.
Let's say the market was in an uptrend and you decided to take a buy long position thinking the price was going to reach your target. It then happens that a reversal has occurred and you aren't aware, you have no stop loss set also because you are sure of the price increase. In the end, your losses continue to increase and then you either exit the trade with a huge loss or let your account be liquidated due to an insufficient margin.
This happened because you didn't realize there was a reversal in the trend of the market. Studying Contractile Diagonals can help you avoid such cases when you identify them on charts.
Also, they give signals to traders to enter positions with the reversal. These signals are accurate most times, but to be on the safer side it won't harm to use technical analysis indicators like MACD to confirm the reversal.
The support and resistance created by the pattern can also be used to trade. For scalp traders, identifying the support and resistance is very important for entry and exit points. One should note that the highs and lows of the pattern do not accurately touch the trendline every time. And so, to make entries or exits, the price point can be a little away from the trendline so that you don't miss the trade.
What happens for the pattern to occur?
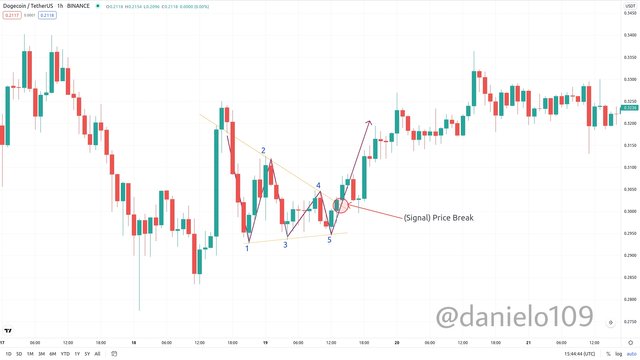
This pattern occurs as the buyers or sellers controlling a particular trend loses momentum after a number of waves to maintain the trend. With the image above you can see the increase in demand causing the price to go higher by the actions of buyers. The sellers try to bring down the price with the next wave but then support is created by the buyers. This continues for a number of waves and leads to a break in support which results in a reversal.

2- Give an example of a Contractile Diagonal that meets the criteria of operability and an example of a Contractile Diagonal that does NOT meet the criteria. (screenshot required / Bitcoin not allowed)
Examples of Contractile Diagonals

Contractile diagonals could be false and give be wrong signals, especially they do not meet the requirements for their wavelength. Below are the requirements:
- Wave 1 should be longer than wave 3
- Wave 3 should be longer than wave 5
- Wave 2 must be larger than wave 4
- The trend line above should touch the highs of waves 1 and 3. Wave 5 is also generally supposed to touch the trendline though that isn't the case at times.
- The trend line below should touch the lows of waves 2 and 4.
- Both trendlines, above and below must converge and the waves decrease with the convergence.
- The trendlines should act as support and resistance levels.
Let's take a look at examples of a Contractile Diagonal that meets the criteria of operability and an example of a Contractile Diagonal that does NOT meet the criteria
A Contractile Diagonal that meets the criteria of operability
For a Contractile Diagonal to be operable, it should meet the requirements listed above. Let's take a look at the chart below.
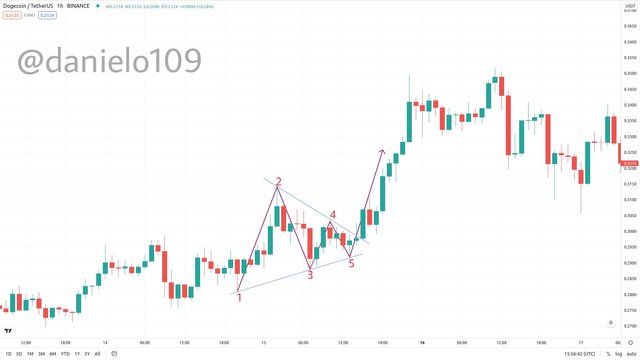
The chart above is a 1H DOGEUSDT chart. From the chart you can notice:
- wave 1 is longer than wave 3
- wave 2 is longer than wave 4
- wave 3 is longer than wave 5
- the upper trendline touches the highs of waves 1 and 3
- the lower trendline touches the lows of waves 2 and 4
- both diagonal lines converge
These requirements have been met which shows that this contractile diagonal meets the criteria of operability.
A Contractile Diagonal that does not meet the criteria of operability
Contractile Diagonals are mostly not operable when a requirement is not fulfilled which simply means the pattern formed isn't correct and so it is less reliable. Let's take a look at the chart below.
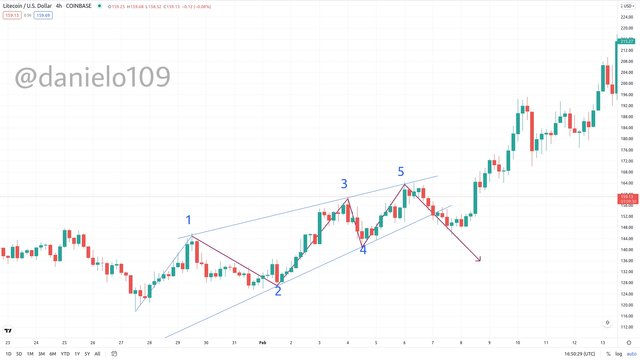
From the chart, you can see that wave 3 is longer than wave 1. We already know it's a requirement for wave 1 to be longer than wave 3, with the first requirement broken the contractile diagonal does not meet the criteria of operability. You can also see that there was no reversal after the fifth wave.

3- Through your Verified exchange account, perform one REAL buy operation (15 USD minimum), through the Contractile Diagonal method. Explain the process and demonstrate the results and graphical analysis through screenshots. Your purchase data must match your analysis data: such as cryptocurrency and entry price.
Trading with Contractile Digonal Method (Buy Operation)

I'm going to perform a buy operation using my Binance android app and account.
I decided to try Binance Future trading with this strategy. The asset I used was DOGEUSDT Perpetual. The Binance Future allows you to leverage x1 to x50 of your capital. It is very risky and so I wouldn't advise anyone to try it if you aren't an expert in trading.
When I arrived the I checked the chart and saw that a contractile diagonal had formed and so I decided to take a buy long position.
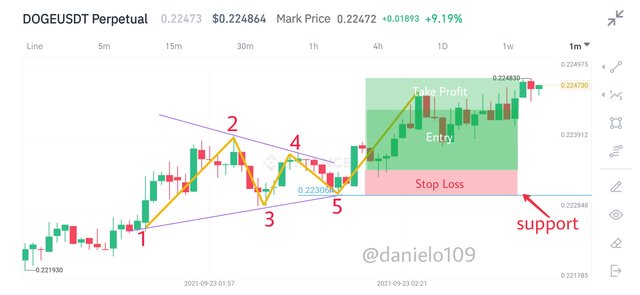
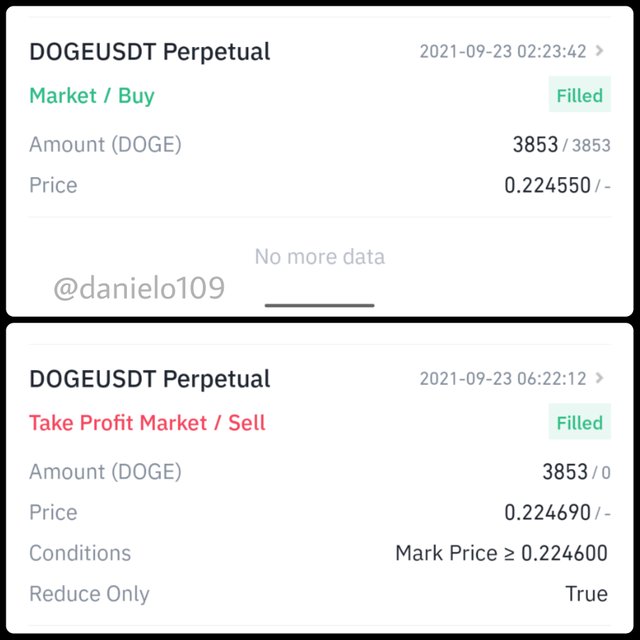
My entry was 0.224550 with an amount of 43.33 USDT. I placed a stop loss at 0.223050 and a take profit at 0.226000. I later changed my take profit to 0.224690. I'm still a beginner in trading so I didn't want to make any mistakes.
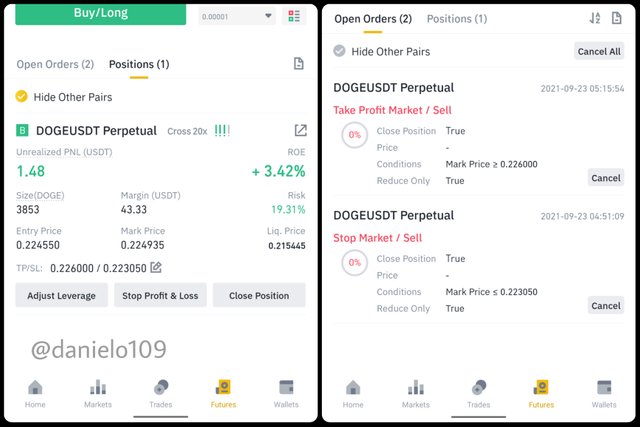
Below is my trade history.
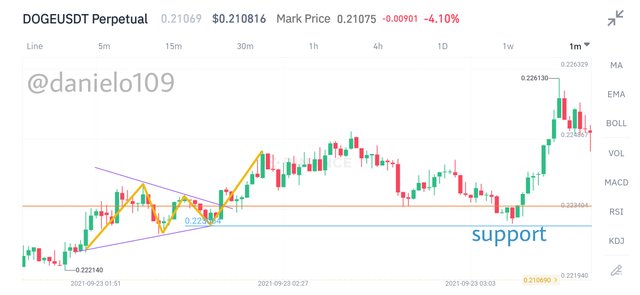
I noticed the lowest level for wave 5 which I used as the stop loss had become a support level for a while before it was later broken.

4- Through a DEMO account, perform one sell operation, through the Contractile Diagonal method. Explain the process and demonstrate the results and graphical analysis through screenshots. Bitcoin is not allowed.
Trading with Contractile Digonal Method (Sell Operation)

I would be using Paper Trading Demo account to perform this task. After noticing the pattern I decided to perform a sell operation.
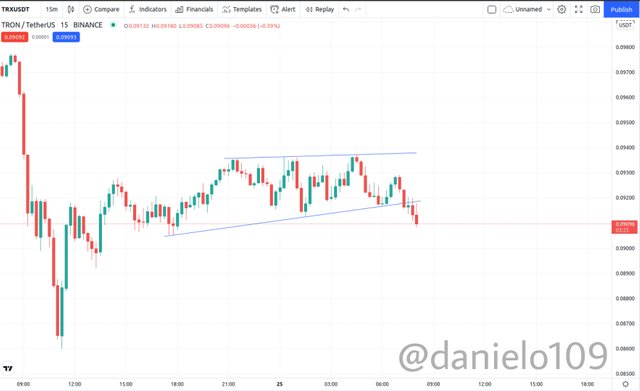
I took a sell short position. My entry was by a market order at 0.09108. The amount was 300 DOGE. My stop loss and take profit were 0.09371 and 0.08868. The Risk Profit ratio is approximately 1:1.
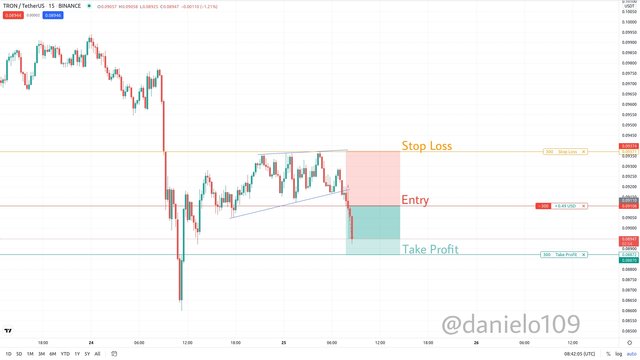
The details of the sell operation can be seen from the image below.

The Stop Loss and Take Profit orders can also be seen below.


5- Explain and develop why not all contractile diagonals are operative from a practical point of view. (screenshot required / Bitcoin not allowed)
Why not all Contractile Diagonals are Operative

From my study of contractile diagonals I realized not all the patterns formed was operative, I'd take two examples of scenarios where they are not operative.
Let's take a look at the chart below.
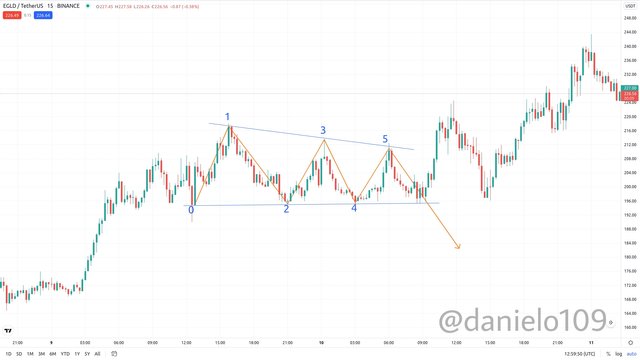
From the chart, you can see that all the requirements have been met but then there is no reversal, instead, the price moves in the opposite direction.
Let's take a look at another event.
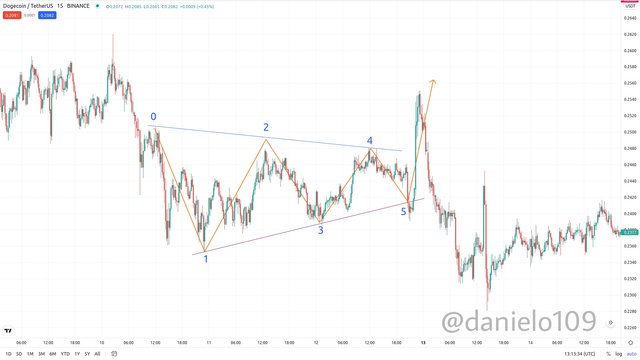
From the chart above, you can see there was a break in the diagonal which signalled a reversal. As you can see the reversal was for a short period after which the price moved in the opposite direction.
These instances where a contractile diagonal isn't operable could result in a loss and so it is advisable to use it together with other technical indicators for strong confirmations before you take positions. Also, the Risk-Reward ratio is something to look at. In the case where the risk is extremely higher than the reward, the contractile diagonal isn't considered operative.

Conclusion

Contractile Diagonals are very important, aside from saving you from huge losses, they allow you to make huge returns from reversal signals given and give room for scalping (this is risky most of the time). I really learnt a lot from this lecture and I'm grateful to @allbert for the knowledge shared. I've incurred some losses due to the non-identification of reversals in a trend and so I know how important identifying reversals can be.
Thank you so much for the knowledge shared, I checked on google and realised it was your work and so kudos for coming up with this great and workable strategy. I hope to learn more from your next lecture.
Hello @danielo109 Thank you for participating in Steemit Crypto Academy season 4 week 3.
For example in questions 3 and 4 you got very good diagonals, but the entry should be done after the break, not before. Also the take profit should be in line with point 2.
In question 5 you forgot to talk better about the Risk / reward ratio and explain it graphically.
Otherwise good job. Keep improving. !!!
Downvoting a post can decrease pending rewards and make it less visible. Common reasons:
Submit
Thank you very much professor @allbert
Downvoting a post can decrease pending rewards and make it less visible. Common reasons:
Submit