Hello everyone, this is my homework post on Crypto Trading with Moving Average. This lecture was given by Prof @shemul21. You can check out his educative post here.
The moving average is one of the common indicators that is used by traders. In this post, I’m going to briefly explain the moving average indicator and how it is used.

1- Explain Your Understanding of Moving Average.
Moving Average (MA)

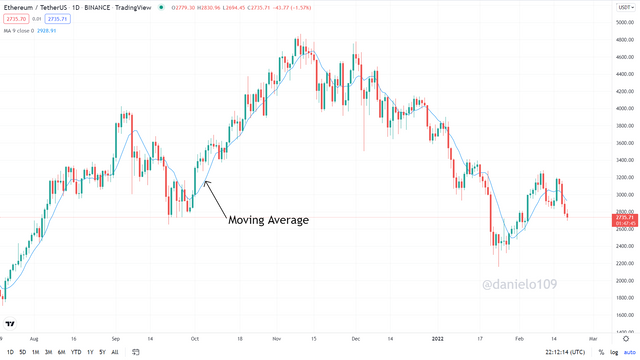
The moving average indicator is a single line overlaid on a normal price chart to show the average prices of the market. This indicator is used by technical analysts to gain more information on identifying market trends, removing fluctuations in price movements and providing good trade signals. The moving average can either be short term or long term. Short term averages react faster to price change of an asset while long term averages are slower to reactions in price.
.png)
The diagram above shows an example of a moving average indicator with a Candlestick Chart. The thin blue line shows the moving average indicator in a chart. Understanding how to use the indicator is quite simple and it is very useful to determine price movements in the market.

2- What Are The Different Types of Moving Average? Differentiate Between Them.
Types of Moving Average

There are a couple of moving averages that are used in trading. Each type of moving average has got difference in parameters and data points and because of this, each moving average appears differently on the price chart. Here, we are going to talk about the three common moving averages:
- Simple Moving Average
The simple moving average as it goes by its name is one of the simplest moving averages. The simple moving average shows the average of recent price data of a cryptocurrency for a period of time. This type of moving average shows only the average price recorded within a period of time. This helps investors to identify good trading signals when price breaks the line. The simple moving average can be calculated by the mean of the stock prices over a period of time. Mathematically, the formula is given below:
SMA = [Sum ( Price, n )]/ n
Where: n = Time Period.
- Exponential Moving Average
The exponential moving average is similar to the simple moving average in measurement of trend direction over a period of time. The exponential moving average is very sensitive to price movement helping short term traders to identify trends earlier than the simple moving average. If a trader is to use both the simple moving average and the exponential moving average, that trader can obtain both long term and short term price information of the market.
The exponential moving average can be calculated by:
EMA = (K x (C - P)) + P
Where:
C = Current Price
P = Previous periods EMA
K = Exponential smoothing constant
- Weighted Moving Average
The weighted moving average is the type of moving average that gives more weight to recent data points and less weight to old points. In this case, the recent points have more relevance than the older ones. Because the recent points are needed for future behaviour purposes. Short term traders find the weighted moving average useful in trading because of its fast reaction to small fluctuations in the market. How to calculate the weighted is stated below:
WMA = (Price1 × n + Price2 × (n-1) +...Price)/ [ n × (n+1)/2]
n = Period(number of days)
Differences Between the Types of Moving Averages
Understanding each of the three types of the various moving averages would help traders find their uses and select the type that would suit them the most in trading. Their differences depend on how they are calculated and this makes them appear differently on the price chart. In this section, I’m going to highlight a few points that show the differences of each type of moving average indicator.
| SMA | EMA | WMA |
|---|---|---|
| Gives equal weighting to all values | Gives higher weighting to recent prices in the market | Gives additional weight to current price points for a current period with more relevance |
| Used for long term trading due to its lagging factor and its slow response to rapid price change | Used for short term trading due to its fast reaction to small fluctuations in the market | Used for full-time trading because it reacts faster than the other Moving average lines |
| With an excessive price value is more dependable to acquire accurate signals | With a lower value can be more dependable | Can be both dependable with both higher and lower values |

3- Identify Entry and Exit Points Using Moving Average. (Demonstrate with Screenshots)
Using Moving Average to identify Entry and Exit Points

The main purpose of using an indicator is to give the trader good signals on whether to enter or leave the market to be able to avoid running at losses. In this section, we going to identify entry and exit points using moving averages.
Before you start trading, you must first determine the trend’s direction by taking into account the period setting of the moving average. Either by short term, mid-term or long term. But let’s use EMA 20 periods here. This type of average line is used for both long and short terms of trading. But one important thing we are going to look at is when price breaks the average line, depending on the area of occurrence.
When the price breaks the MA either above or below, it signals a change in direction of the trend. With this, you can get good signals to enter and exit trades based on the position you're taking.
Entry point (buy position)
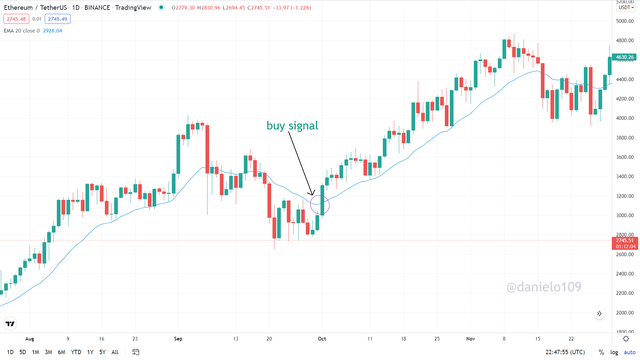
Using moving averages is very simple. For buy entry positions, you first have to wait for the price to break above the moving average.
.png)
The image above shows a buy signal. This can be identified with the break of price above the moving average.
Exit point (buy Position)
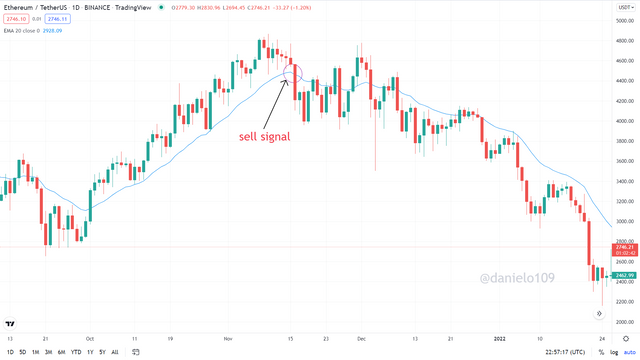
The exit for the buy position should be after the price breaks and goes below the moving average.
.png)
From the image above you can notice the reversal in the trend as the price broke the moving average. The trend became bearish after.

4- What do you understand by Crossover? Explain in Your Own Words.

Crossover requires the use of the combination of two moving averages instead of a single moving average. In this case, the indicator uses two moving averages, a slow-moving average and a fast-moving average. The slow-moving average is suitable for long periods and the fast-moving average is suitable for short periods. The speed of reaction of a Moving Average is determined by the length of its period. The slow-moving average is a 200 length period while the fast-moving average is a 50 length period.
A crossover happens when two moving averages cross each other. When we are trading with MAs we need to look for points where these crossovers take place at. The crossovers signal long term trends.

When the fast-moving average crosses from above and goes below the slow moving average, it signals a bearish trend shift. This type of cross is called the Death cross.

On the other hand, when the fast-moving average crosses from below and goes above the slow moving average, it signals a bullish trend. This type of cross is called the Golden cross.

5- Explain The Limitations of Moving Average.
Limitations of Moving Average

By studying the use of moving averages in trading, we can easily indenting trends and spot support and resistance levels. However, you can’t depend solely on a moving average indicator when trading because sometimes it gives wrong signals. Since the indicator isn’t 100% accurate, it has certain limitations.
Let’s talk about a few limitations of the moving average:
Moving averages have the lagging ability as a result of the calculation of its past price. So basically, moving averages can’t tell the future they only show the behaviour of past prices.
The moving average indicator works well on a trending market but fails to work when finding signals during the sideway or ranging market.

Conclusion

Moving averages help smoothen the price movement of an asset to see its average price movement. Like all other indicators, they are not completely reliable but can be used together with other indicators and strategies to cover their limitations.
The golden and death crosses signal long term trends. They can be slow at times and also give false signals. It is important to note that the possible reasons the moving average can give false signals might be due to fundamental developments of assets. Since the indicator is based on past records of the movement of price, it doesn't take into account the news and other developments.
The moving average is very simple to use and very effective when used during the right periods.