Hello friends and I gladly welcome you all to my article in this great communit. On the SEC: S19W5 I would be answering the required questions for this challenge while participating immediately. I would honoring the invite of @rafk
Define the term Commodity Channel Index (CCI), explain it's role, calculation formulas, component, main purpose, history and interpretation of overbought and oversold values with real world examples. |
|---|
The CCI stands for Commodity Channel Index, it is a special tool used in trading, incorporated with technical analysis, an indicator synchronized with a host of other trading parameters to spot the crucial point of entry and exit of a trade. It aids in sniper entry and also assists in finding the extreme exhaustion point of other trades thus, exiting perfectly or taking actions as the case may be.
Role of Commodity Channel Index
The basic role of the commodity channel index is basically spotting the overbought and oversold zone. Picture a scenario on the oscillator chart, the CCI gets above the 100 mark, it's a warning that it is getting to an extreme exhaustion point this shows an overbought zone. When it goes below -100 it is also showing an extreme exhaustion point on the oversold zone and action should be taken as the trade is about to be reversed.
Calculation Formula Components
CCI = TP-MA / 0.015 × MD
Typical Price: This is the sum of high ad low and close all divided by the individual parameters. That is 3 which stands for each parameter respectively.
Mean Deviation: This is the average of the difference between typical price and moving average.
The result of the sum of high, low and close all divided by the individual parameters would be respectively subtracted from the moving average of the typical price. Subtract from the moving average and subsequently divide by the product constant coefficient 0.015 with the Mean Deviation
Main Purpose
The main purpose of the commodity channel index is to identify extreme exhaustion point in the prices and flexible trend changes. When the CCI move simultaneously above or below 100 it is shown as overbought and oversold respectively. Moreso it shows where trend of the market is moving, mostly when it is bullish or bearish as the case my be.
History
The CCI was developed as far back as 1980 by a financial analyst Donald Lambart. It was built to track cycidal trends across commodities. It has been evolved and widely used by technical analyst traders to analyse stock, bonds and other currencies and contract.
Interpretation of overbought and oversold values with real-world examples.
It has been established that at an overbought zone is exactly when CCI moves above 100 level and it means the asset has assumed it's extreme exhaustion point and higher tendencies of a brief retracement in price.
Real-life examples
A Coca-Cola brand has a new offer of their products, a special flavor which was advertised by big international public figure, it was Carrie by global news and the stock went up, really pretty high, it's at its extreme exhaustion point hours later, as lots of investors invested in the brand, this is definitely entering the overbought zone
Conversely, on the long run about weeks later, there is a buzz or negative review, more like a scandal, negative review has it that people with allergies had a bad heath complication due to the flavor reacting I'm their body, the news went global like wild fire. The negative reviews was much and investors stated creeping out! The stock got low at the point below 100. The stock almost crashed, therefore the price would definitely adjust or retest after the surrounded incident.
Explain overbought and oversold levels, CCI buy as sell signals. Show historical charts demonstrating the use of CCI to spot reversals and discuss potentia limitations of CCI and methods to mitigate them. |
|---|
Overbought Level: When CCI drops from above +100 mark on the oscillator chart. When the asset rises means it has been overbought and this is due to price action and other factors surrounding the event. This occurred due to the fact that asset attained maximum exhaustion point.
Oversold Level: When CCI drops below -100 level on the oscillator chart, it means market has been oversold and this could be reversed due to the fact that asset has reached it's minimum exhaustion point.
The CCI could be used to instigate buy as sell signals as we all know. When the CCI move from below -100 level the minimum exhaustion point back above the line, a reversal from oversold. This is already to sign for a buy activity to occur. When the CCI move back from the maximum exhaustion point back below the line on the oscillator chart it suggests reversal from the overbought zone.
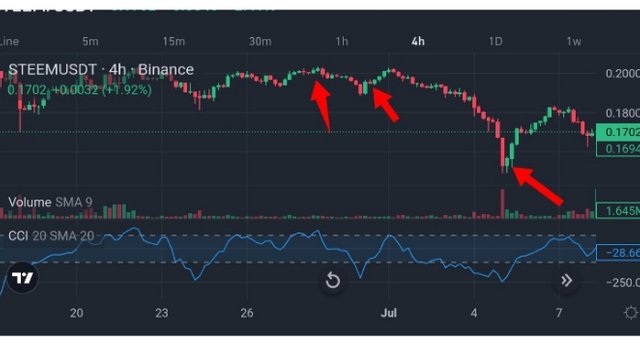
Historical chart demonstrating use of CCI to spot the reversal.

From the image above you can notice that the spotted areas with arrow marks the spot where there is a reversal on the chart. If we can look closely on our oscillator chart which has our indicator we can all see that the point where reversal was seen there is either a drop from the 100 mark at the overbought zone or -100 at the oversold zones respectively.
Limitations of CCl and mitigation methods
The indicators generally are not to be fully trusted during the trading strategy there could be varying false breakouts in the indicators, therefore it is crucial t always use the basic fundamental analysis and technical analysis to perform trading activities. The indicators act as a double confirmation after parameters meet conditions.
Mitigation Methods
The process of mitigation, foremost requires the understanding of the overall trend of the market before diving into the action. Using higher time-frames enables you to study the movement of the market, performing and observing events that took place in each activity. To crown it all risk management enables trader conserve profits while trading. These approaches would definitely aid effectiveness in result during trading journey.
Briefly discuss advantages of CCI, it's use with other indicators, the risk of false signals and impact of cryptocurrency volatility on the effectiveness of CCI |
|---|
Advantages of the CCI
The CCI is indeed important in detecting the overbought and oversold zone if the trading market enabling traders know exact time to enter and exit trades on their trading journey.
It is a great tool in detecting trend reversals, it spots the changes in trend enabling the trader notice, if the traders visit higher time frames.
The CCI is indeed so easy to manipulate it is not really complicated as it operates with basic approaches towards enhancing traders. It is one of the simplest indicators to use in trading.
Disadvantages of the CCI
The CCI indicator in cases provides false signals which could lead to liquidation in Tim's where risk management is not properly observed.
The CCI indicator sometimes is a lagging indicator which gives which could have occured after a while, it's more like watching a replay, it's not so efficient and should be a backup after analysing the main market with other parameters.
Using CCI with other indicators
The RSI is also an important indicator as it shows overbought ad oversold zones, therefore using CCI with RSI brings out the sons perfectly giving you a hint on how you could go further will trading. Using the volume indicator usually portrays the strength of the trend showing emphatically the direction the trend grows, if direction on oscillator chart rhymes with that on the man chart it gives a stronger signal and a good sign that the trend is strong.
Risk of False Signals
False signals could be bad at some point, you could properly see an overbought zone and after analysis try to scalp trade and sell, it takes longer than usual and you end up risking your equity. It is really a thing that occurs when analysed, only with indicators. The time frame most times poses risk of false signals too, it's important to analyse market from a higher time frame to see the overall trend in the market successfully, to avoid false signals that occur in shorter time frame.
Impact of cryptocurrency volatility on effectiveness of CCI
The cryptocurrency market is highly volatile and in most cases the market moves in a conflicting way with the oscillator chart, most traders loose a fortune due to the use of only indicators. High volatility can cause the indicators produce false signals this misleading the traders at some point. It is really a crucial impact.
Choose a recent STEEM/USDT chart using CCI to analyse and identify reversal points, annotate the chart and explain the method used. Discuss volatility and usefulness of these reversals for trading. |
|---|
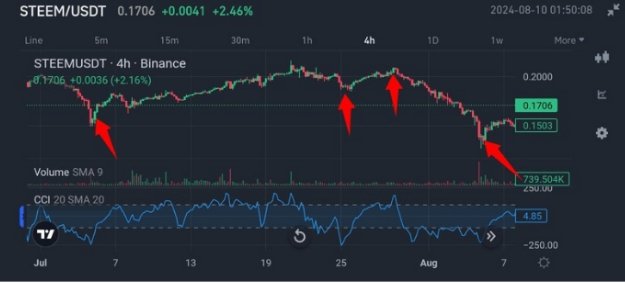
 |  |
|---|
From the chart we can observe that it is about entering a bearish trend, all the marked points are points a reversal occured on the main chart which was also confirmed by the oscillator chart. It is also seen that the indicators used are the volume indicator and also the CCI which shows us the overbought and oversold area seen on the oscillator chart. At every overbought zone there is a reversal and it returns to zero, at every oversold zone there is a reversal and it returns to zero too before changing it's direction again.
Discuss volatility and usefulness of these reversals for trading
The CCI indicator as we all know shows the overbought and oversold, therefore it's important to see that we use the indicators, spotting the right time in the overbought zone to take a entry and also in the oversold zone to take an entry too, all though these varies and could go south at some point. It's crucial to know that the strategy is effecient and should be performed with few double confirmation such as combining with other indicators and proper analysis.
Describe a CCI based trading strategy explain buying and selling rules provide historical or simulated example showing the strategy effectiveness, discuss potential modifications to improve performance |
|---|
The CCI strategy is really a careful strategy in trading you must first wait for the overbought zone to be established to take part, once there it is a above the 100 mark, you wait for a double confirmation which could be a little retracement as a sign that it would be going with, it aids the trader understand the action once double confirmation is observed it's important to take action immediately.
On the oversold zone that is below 100, when the trade gives a retracement from the minimum exhaustion point, action can be taken immediately going long after double confirmation has been observed too. This strategy aids traders to be successful while trading.
Provide historical manipulation to improve performance
 |
|---|
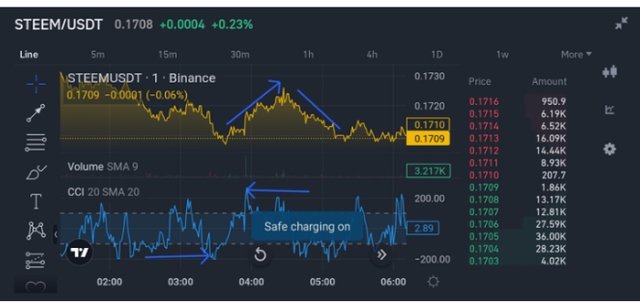
The CCI indicator and volume indicators where used in the oscillator chart, the overall trend of this 4h time frame is about bearish. The point s of retracement are marked on the chart. The lines shows the trend of the chart, the arrows on the oscillator chart shows the overbought and oversold zones of the market. The chart honors the strategy and it is seen in the image above.
Discus potential modifications to improve performance
The CCI is a great indicator as regarding market reversal, it is important to always use the CCI alongside other indicators such as RSI and volume indicator. Importantly it's a indicator which could be a lagging indicator especially in highly volatile market. It can produce false signals which could damage trading. It is important to back test these strategy before fully being engrossed in it. It is great deal of success to use the CCI alongside other trading strategy such as price action. Risk management psycology is crucial as it aids the traders conservative and successful on the trading journey.
all pictures are screenshot and edited with canva app
Thank you, friend!


I'm @steem.history, who is steem witness.
Thank you for witnessvoting for me.
please click it!
(Go to https://steemit.com/~witnesses and type fbslo at the bottom of the page)
The weight is reduced because of the lack of Voting Power. If you vote for me as a witness, you can get my little vote.
Downvoting a post can decrease pending rewards and make it less visible. Common reasons:
Submit
Upvoted. Thank You for sending some of your rewards to @null. It will make Steem stronger.
Downvoting a post can decrease pending rewards and make it less visible. Common reasons:
Submit
I appreciate the real world examples and the insight into combining CCI with other indicators for better accuracy. Its crucial to be aware of the limitations and use complementary tools for a well round trading strategy. Best of luck with the contest
Downvoting a post can decrease pending rewards and make it less visible. Common reasons:
Submit
Warm greetings and thanks so much for stopping by, dropping such valuable feedback on my article. It's an honor to have you once again. Cheers to you my friend.
Downvoting a post can decrease pending rewards and make it less visible. Common reasons:
Submit
The way you explained overbought and oversold conditions with the clear chart example is really helpfull to understand the concept of Commodity Channel Index. The information of disadvantages can assist readers on when avoid signals by Commodity Channel Index.
Downvoting a post can decrease pending rewards and make it less visible. Common reasons:
Submit
Im glad you understood my insights ad wan regards to you my dear friend. I really appreciate the time you shared with me on my article. Success to you on the dynamics.
Downvoting a post can decrease pending rewards and make it less visible. Common reasons:
Submit
THE QUEST TEAM has supported your post. We support quality posts, good comments anywhere, and any tags
Downvoting a post can decrease pending rewards and make it less visible. Common reasons:
Submit
@sduttaskitchen I'm glad you stopped by my article with great support, indeed it is a motivation, I would certainly do more on the platform my dear friend. Wan regards to you once again.
Downvoting a post can decrease pending rewards and make it less visible. Common reasons:
Submit