Greetings friends, it's my pleasure to participate in this season's academy lectures and this is my homework thanks.
1 Discuss your understanding of the ATR indicator and how it is calculated? Give a clear example of calculation
ATR was developed by J. Welles Wilder and featured in one of his books captioned "new concepts in technical trading systems" in 1978.
Nevertheless, this ATR is a volatility measuring indicator that measures the momentum of price action or limit and it is not actually meant for predicting price direction like the RSI and some other indicators that he ( J. W. W.) developed which shows the possible next price action. Nevertheless, unlike the Bollinger bands, the ATR has similar functions.
As already indicated or mentioned that this indicator is used in measuring price Volatility, to be able to interpret the ATR, it denotes that an increase in price volatility in an asset must have a corresponding effect in the Indicator which in order words, the lower or higher the ATR value, similarly the lower or higher the price volatility.
For instance if STEEM takes a volatile bull trend within a particular period, this means there will be a corresponding bull move in the ATR indicator.
With regards to the best deployable period, every trader has his/her choice of possible periods to adopt while considering the use of the ATR indicator, but invariably most traders resort to the 14 days look back periods while trading which is also based on their personal preferences and not as the best usable period.
How to calculate the ATR
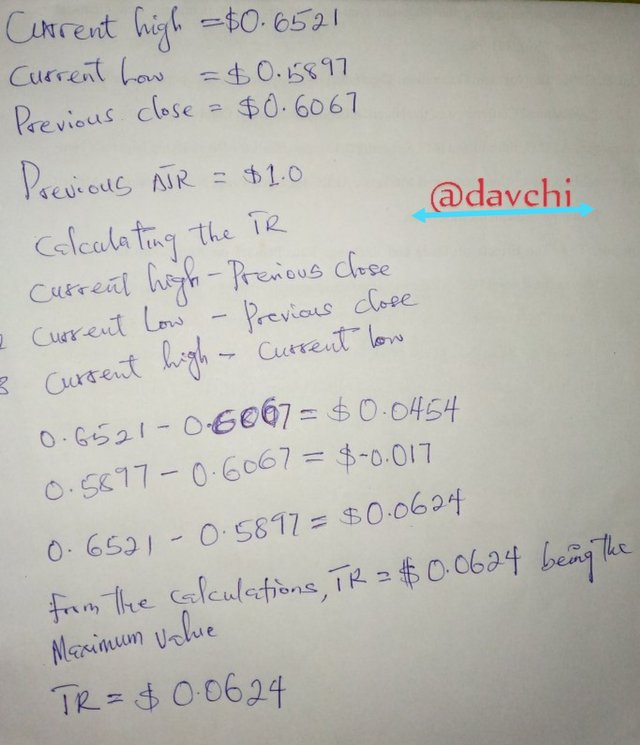
First is to determine the TR and to do this, we have to estimate the following.
current high - previous close
current low - previous close
current high - current low.
Now the TR for the period is obtained from the highest value amongst the three after calculated values using the method above.
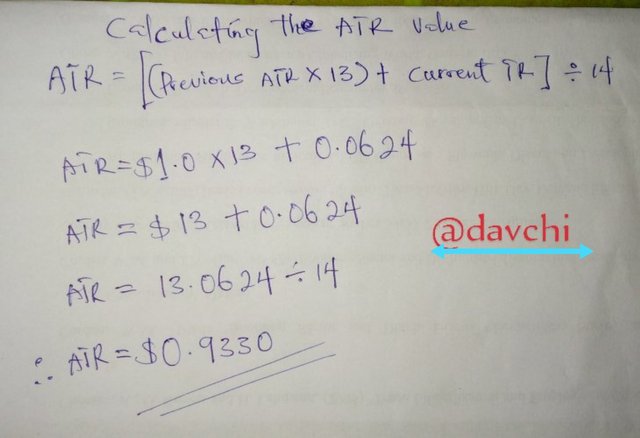
Finally is the Calculation of the ATR.
ATR = [(Previous ATR x 13) + Current TR] / 14
and for look backs other than the default 14 periods, the ATR indicator formula can be calculated thus:
ATR = (Previous ATR * (n - 1) + TR) / n
Calculation of the ATR
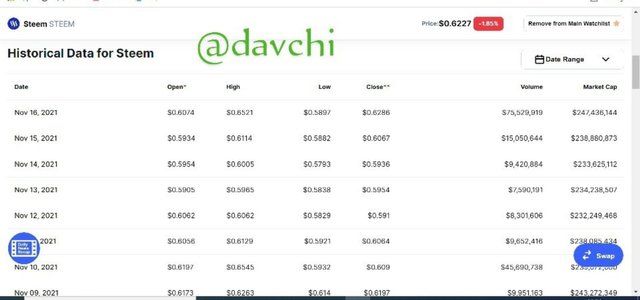
Let's now consider these values of Steem I obtained from coinmarketcap.com within 14 look back periods precisely dated to 16th of November 2021 with an assumed previous ATR stated at $1.

2 What do you think is the best setting of the ATR indicator period?
On the norms, this indicator has a standard setting of 14 days or look back periods and setting it higher than 14 periods will force it to produce a more smoother reading and also dispose it to a less sensitive reading.
And on the other hand, a period less than 14 in the adjustment of this indicator will permit for a more sensitivity and accurate reading with regards to price action.
Meanwhile, the best setting for this indicator is contingent upon the trader's preference as we all know that the indicator itself is not meant for directional signal but to estimate the rate of volatility in an asset despite being employed while trading.
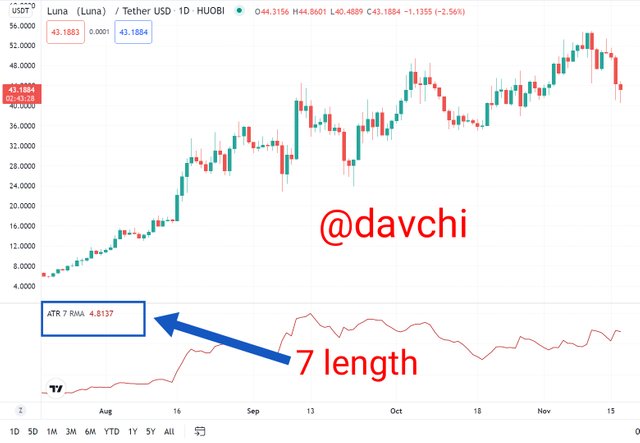
using 7 length period
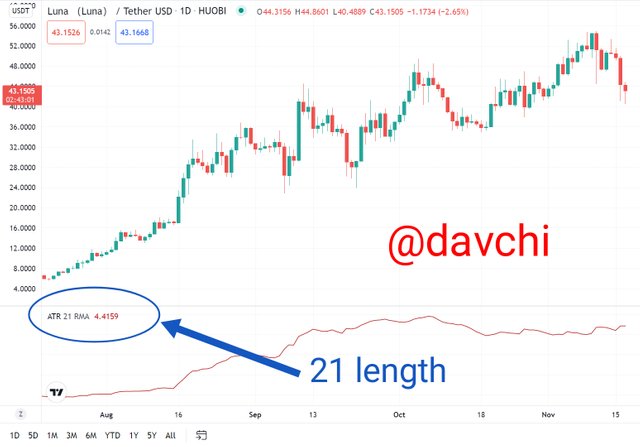
Using 21 length period
From the screenshots above it is obvious that using a 7 length period of this indicator which is actually below the default 14 period, it was able to provide a more corresponding volatile trend of the Luna Asset than when the 21 length period was inserted although this is also a period higher than the default setting.

3 How to read the ATR indicator? And is it better to read it alone or with other tools? If so, show the importance. (Screenshot required)
As it is now obvious that the ATR does not show potential possible price direction as it is not actually an indicator built purposefully for that. Therefore, to be able to read this indicator, we have to pay attention to the price volatility and finally I have to conclude that a lower ATR indicates a decreasing price volatility while on the other hand, a higher ATR signals also a higher price volatility.
On the other hand, it is not really wise to read it all alone as every trader is looking for a possible means of gaining in his trades, either in periods of high volatility or moments of low volatility but since this indicator only corresponds to different volatility levels in the market hence it is very sagacious to deploy other tools that can aid direction while trading like the RSI and some other indicators that are compatible with the trader.
The Importance Of Not Reading It Alone.
Most importantly no one would like to lose his trades despite there being room for losses.
Since this indicator is not a directional tool, it is wise to deploy other tools that can aid direction while trading to avert irrelevant losses.
More so, market trends are not always in a particular direction as it may take an up or down trend at any time and on the other hand since the ATR has nothing to do with either up or down signal, in this regard it is meticulous to use other directional signalling tools as to dictate the next price action as the ATR is incapacitated for such response.
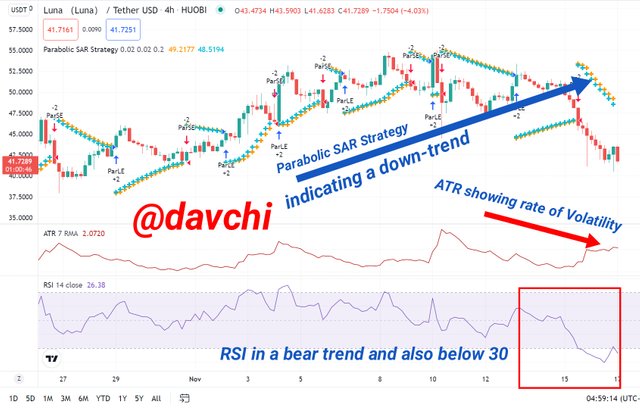
I wish also to respond to this by the inclusion of the RSI and the Parabolic SAR Strategy to the ATR as to attest to the validity of expediency in the inclusion of other tools to the ATR or not.
From the current trend of the market and the screenshot above, we can observe that the Parabolic SAR Strategy and the RSI are in a same directional sequence while the ATR indicator is of a contrary view of the market as it is not actually positing the possible direction the market is taking but rather the rate of the LUNA asset volatility at the moment

4 How to know the price volatility and how one can determine the dominant price force using the ATR indicator? (Screenshot required)
It is quite obvious that the ATR indicator does not necessarily posit the next price action but rather the rate of price volatility.
Hence to determine price volatility in an asset, we have to keep watch at the possible up push or down pull in the indicator.
Price volatility can either occur in the bull or bear side. Nevertheless to know the price volatility, this Indicator has to take a non-smooth movement against its normal trend to push either up or down to indicate volatility either in the red or green candle chart.
And to add to this, during periods of high volatility, the indicator tends to follow a discontinuity of rage movement as it either takes an up or down movement to confirm the high price volatility and on the other hand, a low price volatility is confirmed by a more regular and smooth movement in the indicator.
Finally, the dominant price force is determined by the indicator in response to the immediate and current side where there is more momentum in the market rate of volatility.
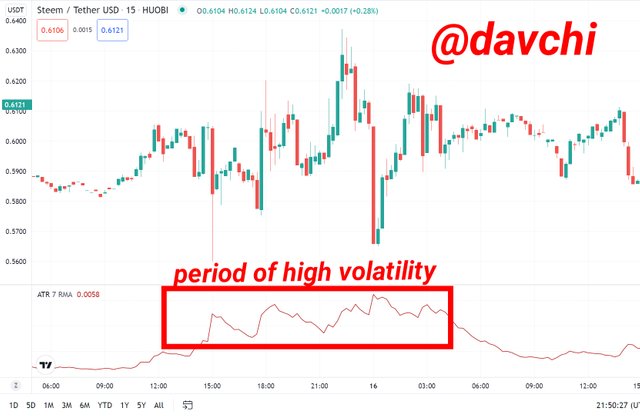
For instance using the STEEM/TUSD chart above, the dominant price force can be determined at the position where there is a more volatile pressure in the price movement and from the screenshot above, I marked it "period of high volatility" since the indicator shows the market rate of volatility and not the potential price trend over a period of time.

5 How to use ATR indicator to manage trading risk ?(screenshot required)
Although the ATR indicator is not actually a direction indicator but on the order hand, a professional application of it can also help a trader in managing risk.
To be able to manage risk using this indicator, one has to wait after the period of high volatility that is correspondingly signalled by the indicator against entering or exiting the market when it is not appropriate, although this is not without the aid of other indicators.
Finally after this period of high volatility, while the market price is then taking a real or true position, it is then advisable to enter or exit the market.
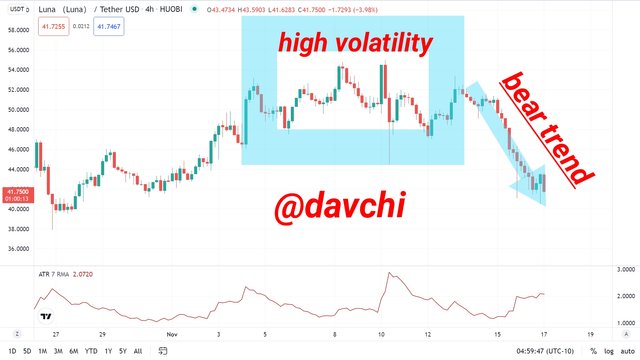
From the LUNA/TUSD above, we can see the obvious volatility in the market which was later followed by a bear trend. So for a trader to be able to manage risk in this market, it is wise to wait after these periods of high volatility and then exit the market at the confirmation of a bear trend or enter for a sell option if one is trading on futures.

6 How does this indicator allow us to highlight the strength of a trend and identify any signs of change in the trend itself? (Screenshot required)
To be able to spot the strength of a trend using this indicator, and invariably since the Indicator itself is a volatility measuring tool, we have to pay closer attention to the high or low movement that it makes overtime which is very significant to price changes and possible trends.
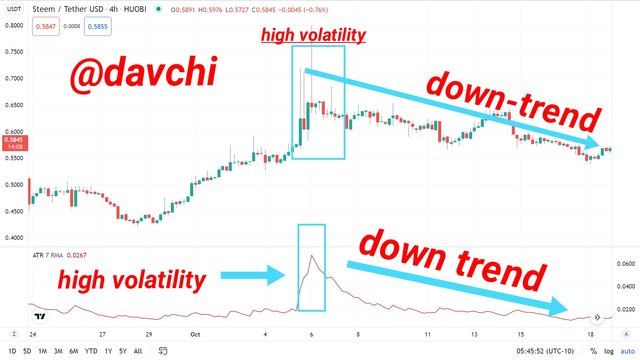
Now taking this example from STEEM/TUSD from Huobi above, we will observe that after the high upwards volatility in the price of Steem, it then started taking a true or real trend which is a down trend. So we can identify changes in the trend after periods of price volatility.

7 List the advantages and disadvantages of this indicator:
Disadvantages of ATR Indicator
It does not show possible price trend on-like some other indicators like RSI, MDX, MACD etc.
A higher length of the ATR indicator like 21 length and above may have no proof of volatility despite being made obvious in the price chart.
A lower length of the ATR indicator like 7 or lesser may show certain market volatility still without any trend signal.
The mathematical calculation of the indicator has no significant effect on the price trend as it only proves the average of a lagged value.
- It lacks the true capacity in signalling moments of entry or exit positions in the market as it also lacks possible annotation price breakout, support or even resistance levels in the market.
Advantages of ATR Indicator
It aids in checking the level of price volatility in the market which qualifies it as a volatility indicator.
Despite being a volatility indicator, it's deployment with other indicators in trading will give a more perfect measure in determining current volatility rate in the market.
Since we know that every support is followed by a resistant level and every high trend is followed by a low trend so also levels of low volatility will have a subsequent high volatility and vice versa, which means that after periods of low or high volatility a trader can either enter or exit the market based on the current market trend.
The calculation of the ATR can help some analyst in determining the average market performance within a certain period.

8 Conclusion:
The ATR indicator is actually a volatility indicator as it does not show the possible trend signal which makes it an indicator that shouldn't be solely relied on while Trading.
Despite not being a trend signalling indicator, it's calculation has a sensible meaning into a certain number of lagged periods.
Finally if any trader intends to trade with it, it should be meticulously used with other indicators to mitigate against trade losses, thanks.
CC: @kouba01
