Greetings pretty friends, it's quite my pleasure to participate in this week's lectures of the second phase of on-chain metrics by professor @sapwood. Here are my take on the hework and I'm happy participating thank.
1
REALIZED AND MARKET CAPITALIZATION
First we have to understand the meaning of the concept of realized capitalization and market capitalization before scrutinizing it's discrepancies.
WHAT IS REALIZED CAPITALIZATION
This could be seen as the last price in which an asset is being merchandized at any given point in time. Therefore it takes into account the last price at which an unspent transaction output is being spent thereby extirpating the effect of redundancies in assets.
WHAT IS MARKET CAPITALIZATION
This is used in measuring the market value or total dollar value of an asset which can be used in comparison with other assets hence it conglomerates both the dormant and spent assets to estimate its value.
THE DIFFERENCE BETWEEN REALIZED AND MARKET CAP
Realized cap. only estimates the current and last price limit when a coin was moved from a UTXO while market cap measures the overall value of a coin from its creation till date.
Realized cap. doesn't take into account dormant coins while the market cap considers all dormant coins.
lost coins are or probably coins that has been spent for long are considered by coinmarketcap.
changes in realized cap will only occur when a coin is spent while the market cap doesn't only effect a change when a coin is spent rather it considers both spent and dormant coins which may have been lost in the cause of transaction for long.
decrease in realized capitalization are noticed when a coin that was bought at a high rate is now spent at a lower rate which will actually reflect on the realized cap while the market cap does not put into account whether there was a loss or not but rather gives a total dollar value of a coin at a given period.
A change in realized cap is noticed by the difference that exist as of when a coin is spent compare to when it was moved to a wallet while the market cap estimates at each time, both the UTXO and the spent coin to ascertain a real or current change in the market.
When the market cap is above the realized cap this is a total profit on the contrary when the realized cap trades above the market cap this entails an aggregate loss.
CALCULATION OF REALIZED AND MARKET CAP IN UTXO ACCOUNTING
First let's go through their formulas as to ascertain the procedures in solving them.
FORMULA FOR REALISED CAP:
(summation of each UTXO) (last movement of price in USD)
FORMULA FOR MARKET CAP:
MKT CAP =Total Supply ∗ Price in USD
THE APPLICATION OF THIS FORMULA:
I'll be using table to illustrate this below and then expanciating it after the table.
Let's consider this asset that is distributed at different time intervals and at distinct prices.
| V | DOC | PTC | VTC |
|---|---|---|---|
| 2 | 24/03/2016 | $1.75 | $3.75 |
| 3 | 15/12/2017 | $5.0 | $15 |
| 5 | 22/23/2018 | $4.0. | $20 |
| 7 | 20/01/2019 | $ 6.0 | $42 |
Meaning of the acronyms or variables:
V= The velocity of the asset
DOT=Date of creation
PTC=Price at time of creation
VTC=$ value at time of creation
REALISED CAP= $3.75 + $15 + $20+ $42 = $80.75
Here I added all the dollar values at the time of creation of this asset or the last price movement after multiplying through.
MARKET CAP= 17 * 6= $102
being the addition of the velocity multiplied by the current value of this asset.

2
ANALYSIS OF MY MODEL IN CONSONANT WITH THE SCREENSHOTS
With respect to these questions I wish to be merging from 7 Days to 3 months and from six months to two years while answering them simultaneously.
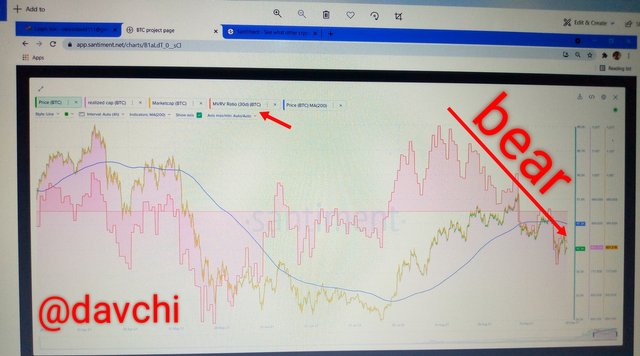
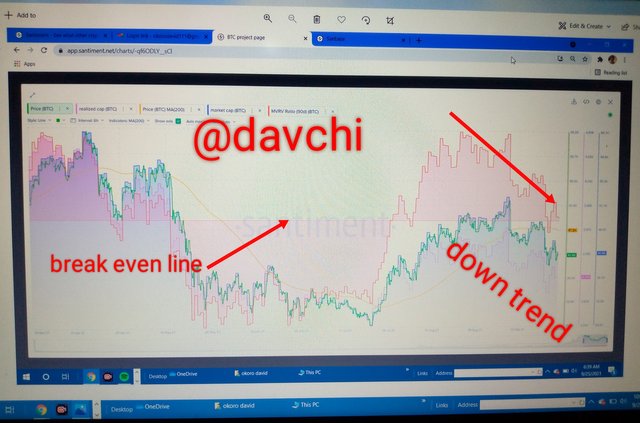
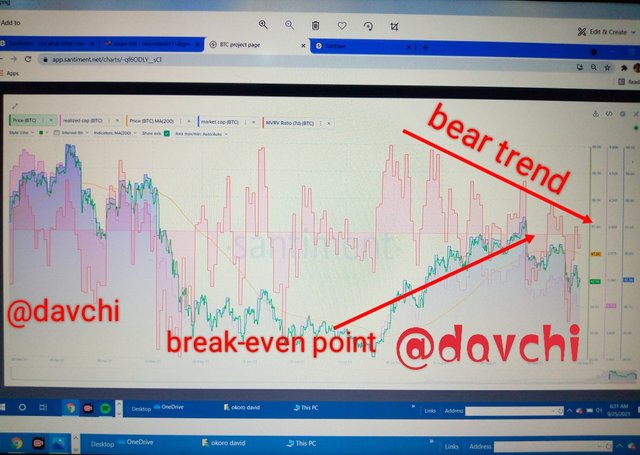
From this model, using a combination of realized cap, market cap, MVRV, price and 200MA with the time frame of 6hrs, we can see that at 7, 60, 90 and 180 days, the price of Bitcoin is on the bear trend exactly at 42.8k according to the price scale after it has made it high position so it's now taking a beer trend and probably may go deep to face another accumulation period and at this phase, the possibility of quick recovery is so minute and diminutive taking into account that it is below the horizontal axis.

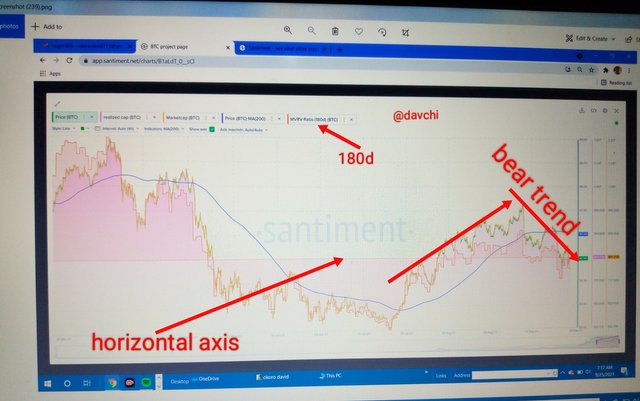
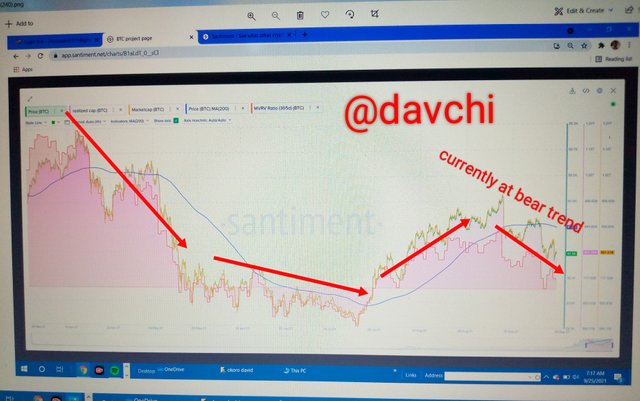
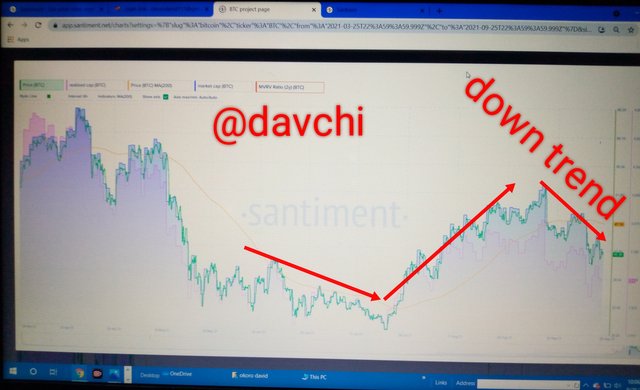
Using this long run of 180 days that is 6 months, 365 days and 2 years respectively we can deduce and it is still obvious that the price level is going below the horizontal line which is an indication of a long time downtrend meaning that using the realized cap, market cap, price level and MVRV prices is currently on a downtrend but precisely at 47K and may take a very long time for it to reverse to cut across the horizontal line at the upper base again.
Now the point where I marked break even point does not actually mean a point of no loss or profit but it's actually an indication of oversold and overbought region in the market.
THE CORRELATION OF THESE INDICATORS TO PRICE.
All these indicators combined together can be used to predict what that can happen to price at any given period.
Prices of assets above the horizontal line indicate an increase in price and it is bound to fall.
These indicators are same directional indicator, in other words they are not contradictory, as this is observable where MVRV is positioned in a down trend the other indicators also takes the same direction.
Prices below the horizontal line shows a decrease in the value of asset
When price rises above the horizontal line it is certainly bound to fall below it again and likewise when it falls deep below it, which signifies high liquidity, and hence prices are bound to rise. Now applicably to this scenario, it is observable using the price indicator, realized cap, market cap, MVRV and the 200 moving average, that prices has gone very high above the horizontal line and is now in a down-trend and it will go a little bit lower before coming up again to cross the horizontal line. All the Periods above indicate that the price of BTC is on the beer trend and has a long time negative price effect although it is not perpetual since this is a crypto-currency.

3
MVRV AND THE REALISED CAP
MY STAND ON THE MVRV INDICATOR
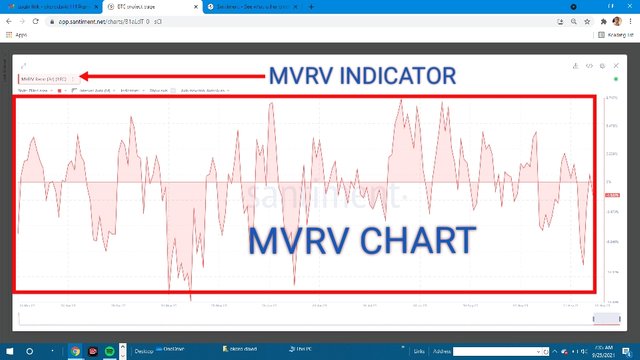
The MVRV is actually proficient in price predictions, as you can see using this this indicator, it is dissected into two, the upper section and the lower section.
The upper section signifies periods of price increase while the lower section signifies times of lower prices.
THE RELIABILITY OF THE UPPER THRESHOLD AND ITS SIGNIFICANCE
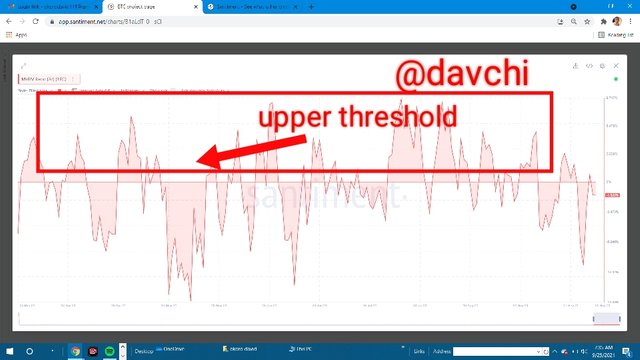
The upper threshold is the period above the horizontal line and it signifies and oversold region. Nevertheless prices above the horizontal line which is now at the upper threshold are bound to fall especially when prices get up to the position of 1T and above and here it is advisable for traders to sell.
THE RELIABILITY OF THE LOWER THRESHOLD AND ITS SIGNIFICANCE
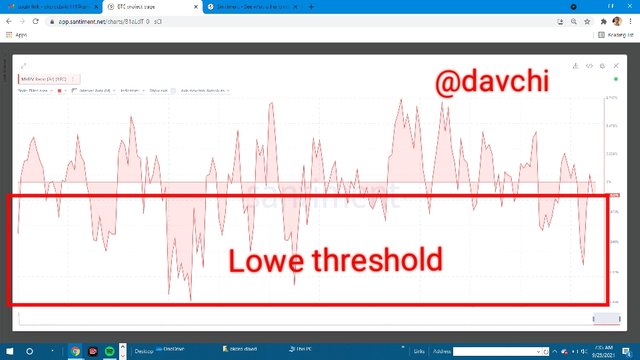
The lower threshold is a period of price decrease and also a time best for accumulations. Nevertheless price at this section is bound two reverse in an upward direction again for market adjustment and maintaining equilibrium.
THE POSSIBLE CONDITION FOR A DOWNTREND USING THE REALIZED CAP
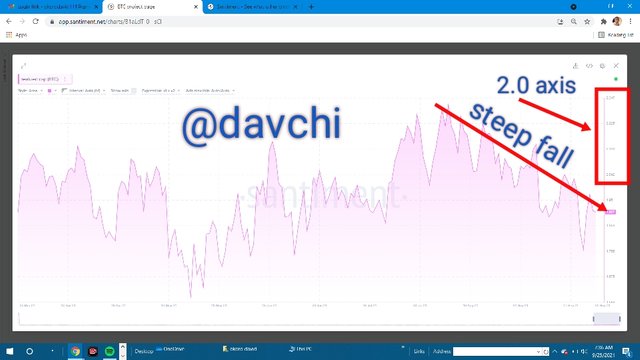
- It is also obvious that at oversold region, prices are bound to fall so after prices has made it's high position possibly at the 2.0 horizontal axis and above, it is actually bound to fall in a steep direction.
A steep downtrend in a realized cap indicator is possible only when prices are above the 2.0 horizontal axis of the price scale which is also an indication that holders has released their assets which now ensues a steep fall in price.
Therefore a disposition which we can also affirm to be the position where the market will be in a steep fall using this indicator may not practically be noticed except with the addition of some other indicators like the addition of the MA to show period of true resistance point because of the stochastic nature of this indicator which makes it a bit difficult to be solely used.

CONCLUSION
The realized cap and the market cap are good parameters for analyzing market behaviour of assets but the realized cap can actually serve as a better parameter compared to the market cap since it can offer the market values of assets with regards to its actual velocity in the market while the market cap is more of an estimated value which may lead to an over count of an asset which may have been lost for long.
On the other hand, SANTIMENT can offer a good predicting behavior of assets for a very long period using different indicators like volumes, Whales behaviour, MVRV, Price level, Realized cap, etc. which eulogizes it as a very good app for predictions.
Finally the MVRV is actually a better indicator to distinctly identify when prices will either rise or fall both in the short and long period as the case may be, nevertheless all the screenshots were taken from santiment.netthanks.
Cc: @sapwood
Cc: @fredquantum
