Greetings friends, it's my pleasure participating in this week's on-chain metrics research by professor @sapwood. Below are my answers to the questions.
(1) How do you calculate Relative Unrealized Profit/Loss & SOPR? Examples? How are they different from MVRV Ratio(For MVRV, please refer to this POST)?
To calculate the relative unrealized profit/loss, we have to first consider or determine the market value or market cap, realized value and then the unrealized profit/loss of an asset.
First the market price of an asset is determined by multiplying the current price of that asset by its circulating qty in the market which is also the market cap in other ways.
Next the realized price which takes into account the price of an asset when it was last moved from one wallet to another that is the UTXO and then adds it up with all individual values and then take their average price, now it multiplies the total circulated number of that asset by the average number to give us the realized value.
Next the subtraction of the realized value from the market value now gives us the unrealized profit/loss which is an estimate of the total profit or loss in an asset and by signs and magnitude, we are in profit when the sign is positive and in loss when the price is negative.
Now to determine how this value changes relatively overtime is the need to calculate the relative unrealized profit /loss.
Finally to determine the relative unrealized profit/loss, we have to divide the unrealized profit/loss by the market cap which then creates relative unrealized profit or loss which helps traders in creating their own market sentiment.
Therefore, RUPL= Market cap - Realized Cap/Market Cap
and with this formula, we can easily calculate the unrealized profit/loss.
Assumption
Let's take this example below for a better comprehension.
Let's assume that we have 3 Steem UTXO in circulation in 2020 and in 2021 when the price shoots up the hodler decided to move both of them at $1.8, $1.5 and $1.9 each but currently the price of Steem is $0.65. using this, let's determine the price of Steem.
First the circulating supply is 2
Current price of Steem is $0.65
Steem Market Cap= current price * circulating supply i.e $0.65 * 3 =$1.95
Realized Cap: $0.3+ $0.4 + $0.5= $1.2
Therefore RUPL= ( 1.95 - 1.2) ÷ 1.95 =$0.38
Next to determine the SOPR, we have to divide the selling price by the purchased price, so we have;
Paid price of UTXO = $0.3 + $0.4 + $0.5 = $1.2
Sold price of UTXO = $0.65 * 3= $1.95
Therefore SOPR= 1.95 ÷ 1.2 = $1.6
Therefore since the value of SOPR is greater than 1, it postulates that we have made some profit.
THEIR DIFFERENCES FROM THE MVRV RATIO
On the norms, they are all fractional variables but makes use of different coefficients in arriving as a product.
The RUPL
Nevertheless, the RUPL is a fractional product of the total market Cap less then the realized cap over the total market cap.
The SOPR
This shows the monetary value of the sold asset over it's purchased price
The MVRV
This on the other hand shows the total market value of market cap over the realized cap
Finally the only difference is that they are calculated using different measures that is they don't have a unified means of calculation in the sense that the formula used in calculating RUPL=SOPR=MVRV this is what that actually made them to vary from each other.

(2) Consider the on-chain metrics-- Relative Unrealized Profit/Loss & SOPR, from any reliable source(Santiment, Glassnode, LookintoBitcoin, Coinmetrics, etc), and create a fundamental analysis model for any UTXO based crypto, e.g. BTC, LTC [create a model to identify the cycle top & bottom and/or local top & bottom] and determine the price trend/predict the market (or correlate the data with the price trend)w.r.t. the on-chain metrics? Examples/Analysis/Screenshot?
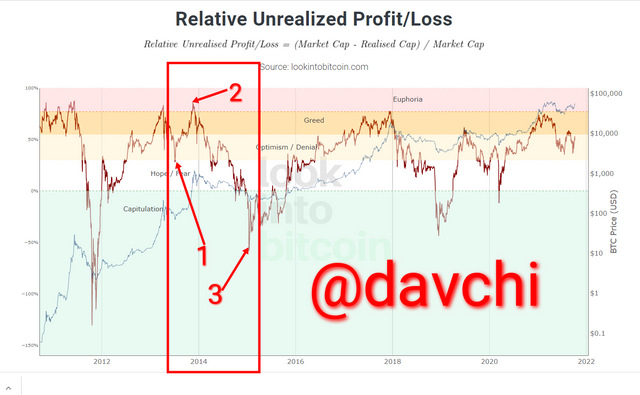
To illustrate this, I will be using the BTC asset to expatiate the entire process with the scope of about a year and 6 months starting from 7th of July 2013 to 17th of January 2015.
A Few Points To Note:
- RUPL above the 0.75% level which is the horizontal line connecting the greed and euphoria axis also a level known for the cycle top, it's actually an indication for a sell option against price reversal
RUPL below 0% or at the negative zone, this represent accumulation stage and it is also remarkable for circle bottom.
RUPL taking an average range between the 0% and the 75% area is an indication that price could either go on the bull or get on the beer but the real trend at this level will be determined by the range at which the RUPL is taking.
EXPLANATION OF THE SELECTED AREA WITH RESPECT TO PRICE AND THE RUPL.
From the first arrow which is actually on 7th of July 2013 the RUPL made it's double bottom at the hope/fear axis at 29% with price stated at $82.75 this is an indication of price rebounding that is price taking a reversal bull trend and also a period of accumulation.
Hence we can also see that price took a bull trend after the double bottom that the RUPL made at the hope region which lasted for a period of about 5 months.
At five months interval which is the second arrow, precisely on 29th of November 2013, this trend which is a bull trend that kicked off after the circle button in the same year made a significant circle top at 86% with price stated at 1183.59 dollars, therefore we know that this region which is the euphoria axis is normally known for reversal whenever the RUPL hits this area although it may linger for a while but has everything tendency to reverse and at this point it is advisable to sell as the price is diminishing or swap the Bitcoin for a stable coin like the usdt against value loss.
Nevertheless we can also see that the RUPL reversed in a bear trend after making it's cycle top at 86% of the euphoria region
After about 13 months precisely on January 2015 being the 3rd arrow, when the RUPL has made it's significant circle top at 86%, price fell drastically to a negative percentage which is -55% and price pegged at $241 0.05, indicating another recapitulation or accumulation period with the cycle bottom validating it, and from the RUPL we can see that price started taking another bull trend after this drastic fall and since then price has not fallen to this extent hence, validating another accumulation period with the cycle bottom.
Finally we can also deduce That critical rise and critical falls are determined after the circle top at the euphoria region that is within the 75% axis and after the circle button at the capitulation or the accumulation region still within the 0% and negative value axis even as we can see from the correlation of price to the RUPL above.
Currently using the RUPL as of the time of making this post, the price trend is on the Bull at about $53,892 as of 7th of October but the RUPL posited a weak bull as it's still at the optimism stage with the tendency to fall because its previous rise caught up with the 75% axis and started going down so it is believable that price may fall steeper after observed cycle top within the previous period which is around 8 of January 2021.
ANALYSIS WITH RESPECT TO SPENT OUTPUT PRICE RATIO (SOPR)

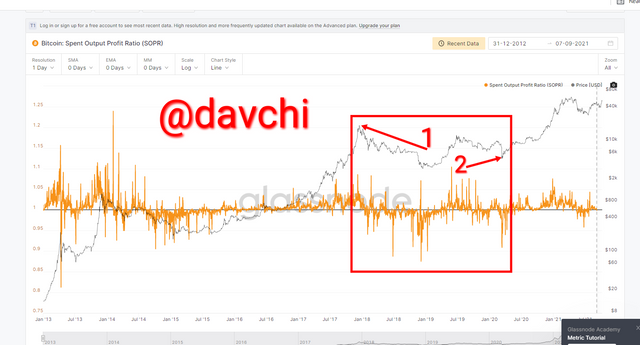
Screenshot from studio.glassnode.com
But we need to note the following:
- In Bull cycle, if the SOPR approaches 1 or is getting across 1, it's an opportunity for a buy market option
In a bear cycle, if the SOPR approaches 1 or perhaps slightly cutting across 1, it actually calls for a sell option.
If the SOPR goes below 1, it therefore forms a local bottom and if it goes above 1, it forms a local top.
Let's consider SOPR for BTC within a period of 3 years that is from 19/12/2017 till 14/03/2020
From the screenshot above, it is observable that at the first indicated arrow, being Tuesday 19th of December 2017, there was a hike in price stated at $17,737.66 which also created a local top as validated by the SOPR coming above 1 where the SOPR is at 1.02497531
Next, on Saturday 14th of March 2020, the SOPR created a local bottom which was also below the 1 horizontal axis with coefficient 0.96089223 and BTC value also depleted to $5,195.86 because of the local bottom.
But currently with the BTC price at about $54,000 and the SOPR slightly above 1,there is the tendency for price appreciate within a few period

(3) Write down the specific use of Relative Unrealized Profit/Loss(RUPL), SOPR, and MVRV in the context of identifying top & bottom?
The three indicators are on-chain metrics that considers and are best used for a long term price prediction and the three indicators makes use of the UTXO in determining their values.
The RUPL is used in determining cycle bottoms and tops
The SOPR is used in determining local tops and bottoms
The MVRV is used in determining signals with the combination of either RUPL or SOPR.
CONCLUSION
The Relative Unrealized Profit/Loss is a good on-chain metric which aids in identifying respective cycle tops and bottoms which can assist a usert to either enter or exit the market for a long term trade.
The Spent Output Price Ratio is also a good on-chain metric that also helps in price determination or prediction although not really a perfect indicator due to its high stochastic nature but with the aid of local tops and bottoms and the SOPR above or below 1 in a precise trend that is either shows the bull or bear can assist a user to decide the trend of the market but it is not reliable to be used alone.
Thanks for going through.
Cc@sapwood
