I wish to appreciate professor @kouba01 for this week's incredible lecture in trading the ADX which is absolutely a good strategy in placing trades when combined with the +DI & -DI.
Below is my comprehension and answers to your questions thanks.
1.Discuss your understanding of the ADX indicator and how it is calculated? Give an example of a calculation. (Screenshot required)
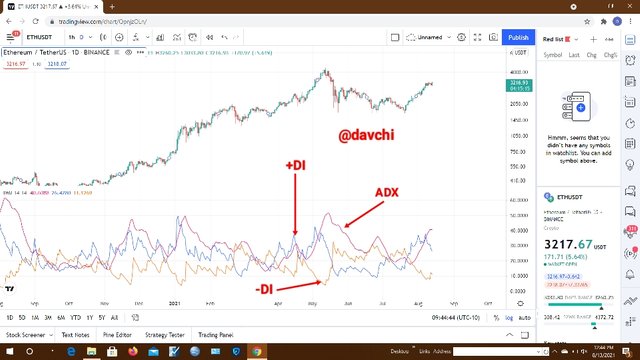
The ADX indicator was invented by J. Welles Wilder in 1978 specifically for tracking commodity daily prices but it was latter broadened to encorporate other markets using different time frames.
Nevertheless, this indicator is mainly used in determining the strength of a given trend after it has established it's trend which makes it a lagging indicator. Therefore it has two directional indicators in it, which are; the positive directional indicator which is the +DI and the negative directional indicator which is also the -DI.
Now let's take a schematic look of the strength of ADX in the market with respect to their values.
ADX VALUES BETWEEN 0 TO 25:
This shows a weak value and also indicate an absence of trend.
ADX VALUES FROM 25 TO 50: This shows that there is a strong trend in the price chart
ADX VALUES BETWEEN 50 AND 75: This shows or indicates a very strong trend in the price of asset.
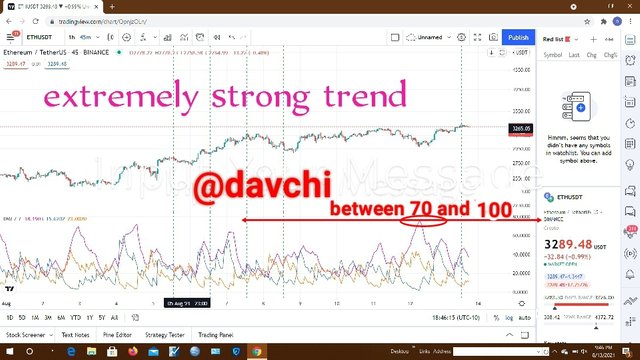
ADX VALUES BETWEEN 75 AND 100: This shows an extremely strong trend in the price chart.
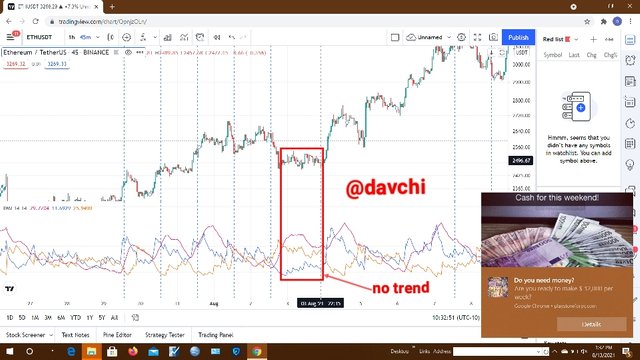
At this point there is no trend in the ADX and we can also see the positive directional index horizontally at the base, that is the blue line from the stochastic trend in the chart.
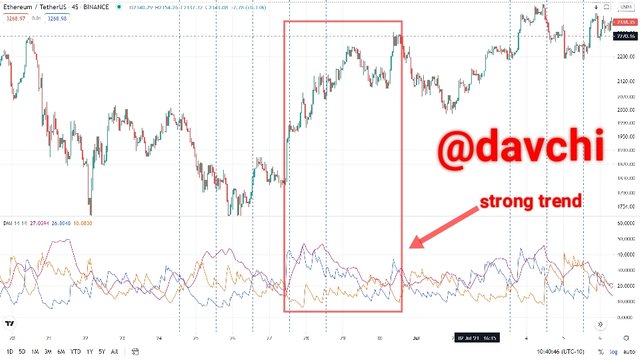
This shows that there is an obvious trend in the chart as the there is a cross of the lines especially the +DI (the blue line) crossing the ADX from beneath.
Sincerely there are diverse means in calculating the ADX but I'll be using the means I was able to comprehend from my research.
1- First is to calculate the True Range
FORMULA:
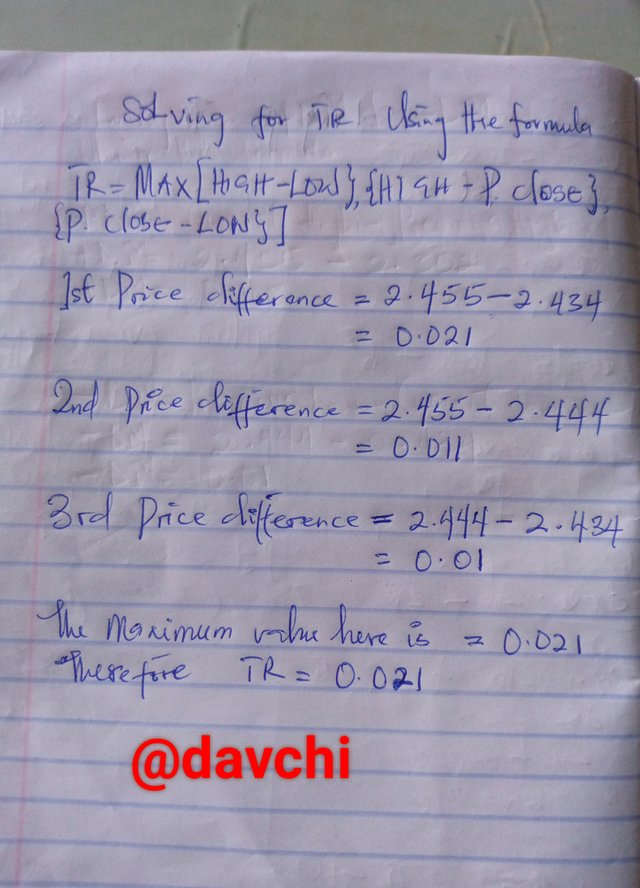
TR= MAX [ {HIGH-LOW}, {HIGH - P. CLOSE}, {P.CLOSE - LOW} ]
2- secondly we calculate the Average of the True Range
FORMULA:
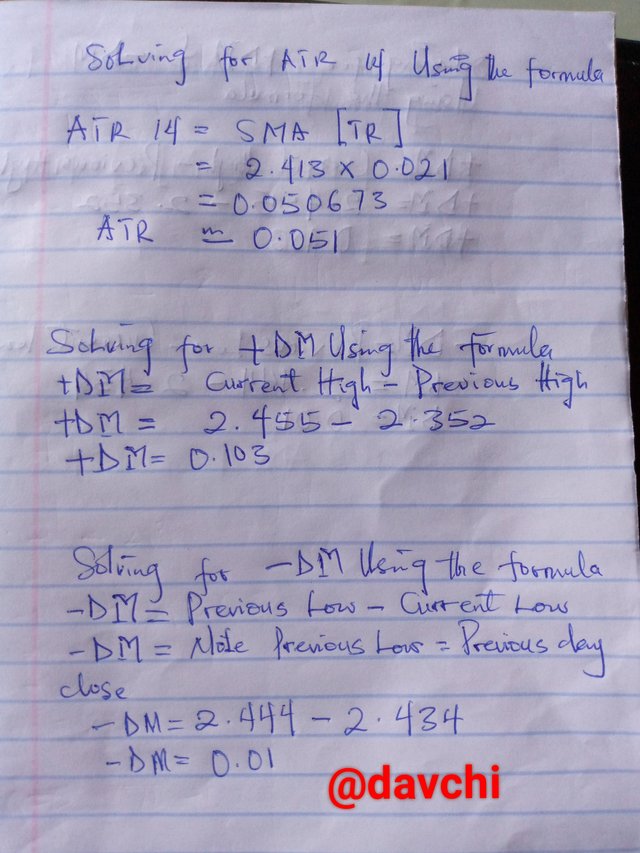
ATR 14= SMA 14 [ TR ]
3- Thirdly we calculate the positive and the negative Directional MOVEMENT ( +DM, -DM )
FORMULAS:
+DM= CURRENT HIGH - PREVIOUS HIGH
-DM= PREVIOUS LOW - CURRENT LOW
4-Then we calculate the positive and negative directional index ( +DI, -DI ) by using the calculated values of ATR, +DM & -DM
FORMULAS:
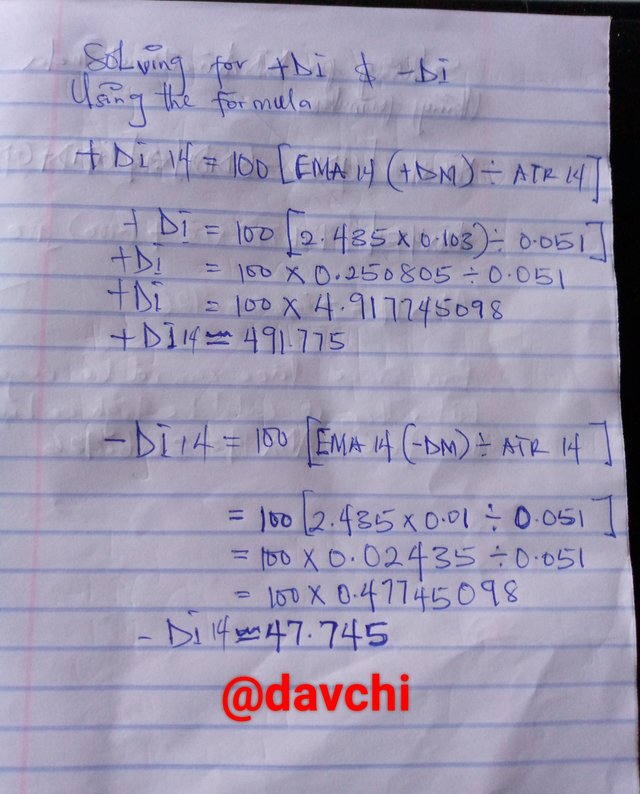
+DI 14 = 100 * [ EMA 14 ( +DM ) ÷ ATR 14 ]
-DI 14 = 100 * [ EMA 14 ( -DM ) ÷ ATR 14 ]
5- Next we calculate the value of the directional index proper ( DI )
FORMULA:
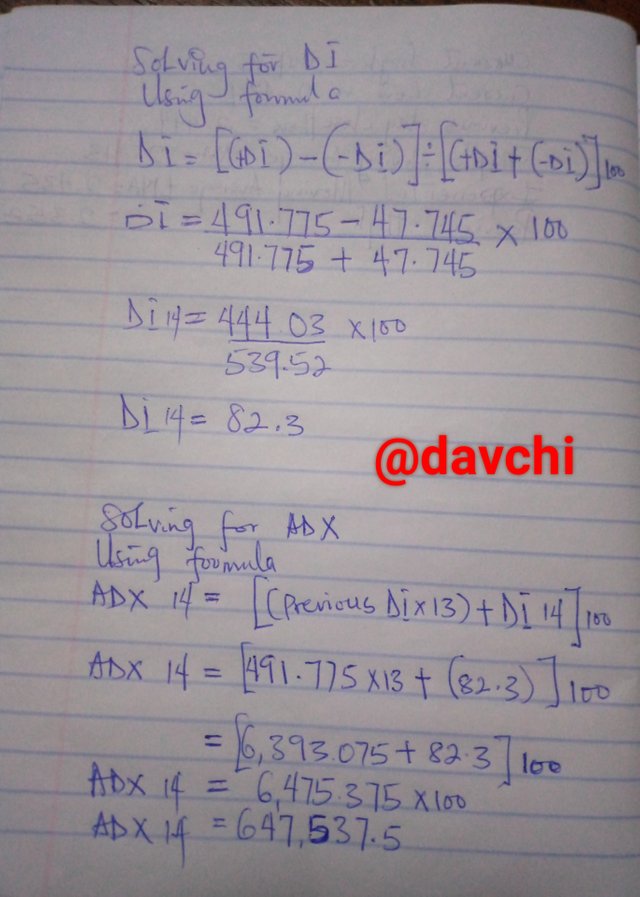
DI 14= [ ( +DI 14 ) - ( -DI 14 ) ] ÷ [ ( +DI 14 ) + ( -DI 14 ) ] * 100
6- Finally we calculate the value of thr ADX it self.
FORMULA:
ADX 14 = [ ( PREV DI 14 * 13) + DI 14 ] * 100
Assuming a cryptocurrency with these indicated values:
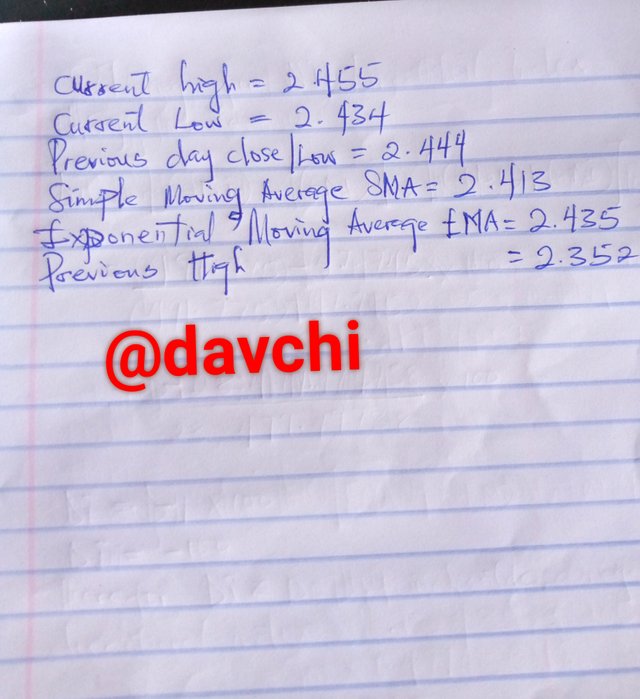
First we look for the TR
Next we find the ATR and proceed to solving +DM & -DM
Next we solve for the values of+DI and -DI
Next we find the value of DI and finally the value of ADX proper

2.How to add ADX, DI+ and DI- indicators to the chart, what are its best settings? And why? (Screenshot required)
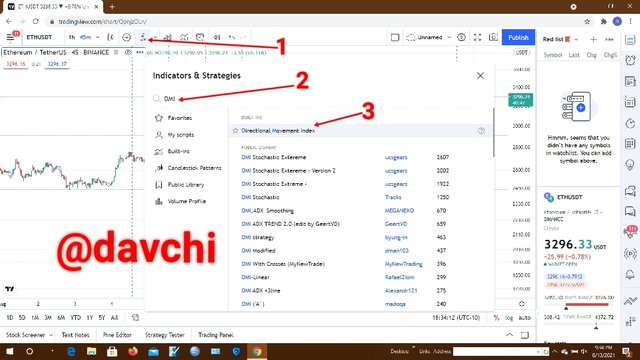
These are the procedures for adding ADX, +DI and -DI into chart.
I'll be illustrating this using a pair of crypto on trading view.
1-First I login to trading view as I already have an account there
2-Next I choose the crypto I wish to track it's trend
3-Next I click on the function (FX) icon at the top bar
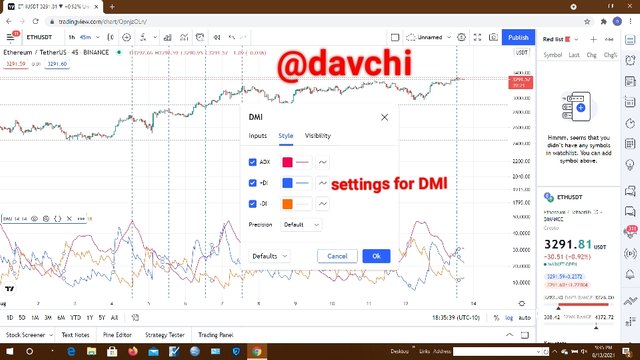
4-Next i search for DMI because it has an in-built of +DI and -DI in it, so as I click on it, the ADX indicator will be automatically added into my chart and we can actually see that from the style.
Finally I may change the inputs, style and visibility to suite my trading pattern or to leave it in it's default settings.
ADX INPUT 7:
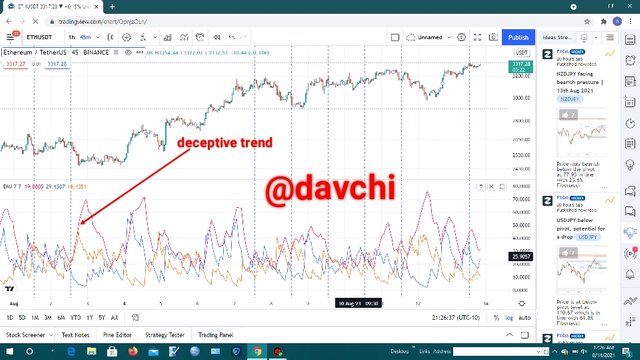
This is a short term setting in the index strategy of the ADX. It usually shows every bit of slight changes in the price of any asset in view despite it's volatility, it give a distinct indication on the charts for traders to follow. It can also be misleading considering the fact of high market volatility which could lead to breakout if irrationally followed.
ADX INPUT 35:
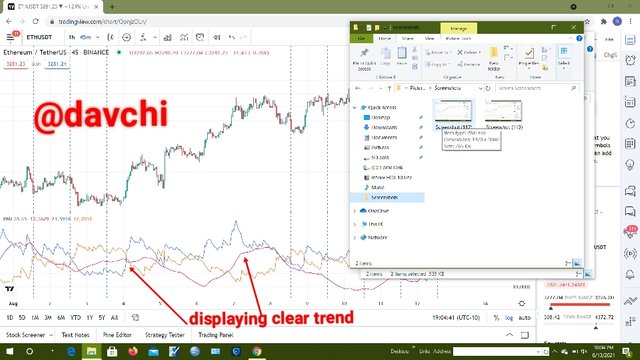
This is another setting in the ADX input strategy which displays a more clarified trend indication, moreso it exhausts more time on price charts to actually take a true trend in the market and this could be relied upon for trades.
The ADX on the norms has the input 14 as it's default setting, the input 7 as it's short time frame and input 35 as it's long time frame and amongst these input strateges, the 35 input setting is the best possible setting because it follows the true trend of an asset against fake prices which could get a trader trapped in a fakeout condition.
Nevertheless, the 7 input strategy is not the best time frame although it shows every possible trend that the chart is taking but it could also be deceptive due to the volatility in cryptocurrencies likewise the default setting although it could be helpful to certain extent but the 35 input strategy still stands as the best strategy so far because it follows the true trend of the asset price.

3.Do you need to add DI+ and DI- indicators to be able to trade with ADX? How can we take advantage of this indicator? (Screenshot required)
The ADX proper is just a line that shows the strength of a trend, it doesn't necessarily posit the trend the chart should be taking.
Nevertheless, we can add some other indicators into it to assist in determining the trend of a trade that is in the case of traders as as using it alone most times could be confusing and deceptive.
So it is not compulsory to add the +DI and -DI before you could use the ADX as you can use it with some other indicators like the MACD, RSI amongst others.
On the other hand, it's also proficiently expedient to add the positive and negative DI to the ADX to trade charts because of its exquisite function in trends as its different crosses have significant impact in determining possible trends that could be favourable and profitable to a trader.
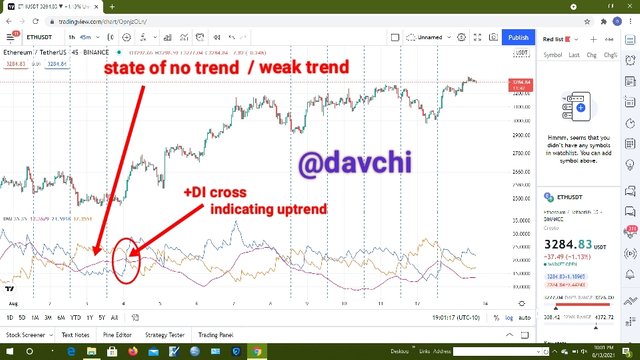
After inserting the DMI which conglomerates the positive and negative DI, we then have to pay proper attention to the crosses of the DI against the ADX and also their selves especially the +DI which shows the strength of the EMA and the positive DM over the ATR that is the blue line according to my setting so we pay attention to it because of it's magnanimous effect.
On this regard, It is also expedient to use it with input 35 setting for a clearer and distinct trend as a long time frame.
Nevertheless with regards to trading with it, a correlation of either the +DI and the ADX or the +DI and the -DI crossing from under to the top Spurs an up-trend or price increase in the chart while a cross of the +DI that is the blue line from above the -DI and or the ADX to beneath it results to a price decrease of the asset or a low trend.
With the help of the +DI and the -DI we can also dictate whether the trend is on weak trend, strong or very strong position.

4.What are the different trends detected using the ADX? And how do you filter out the false signals? (Screenshot required)
There are four trends that are detectable by the ADX and they are: the non trend, strong trend, very strong trend and the extremely strong trend.
Below are the trends I was able to detect using the ADX
This position shows no trend as it's value stands between 0-25
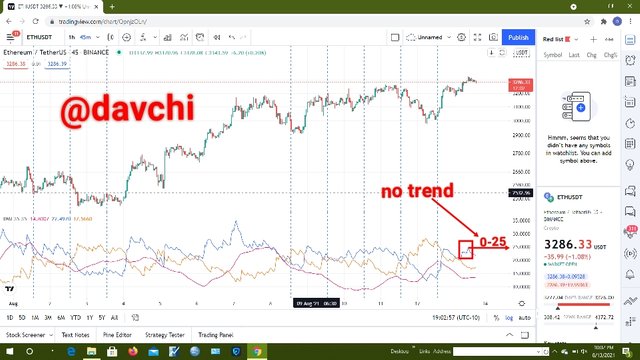
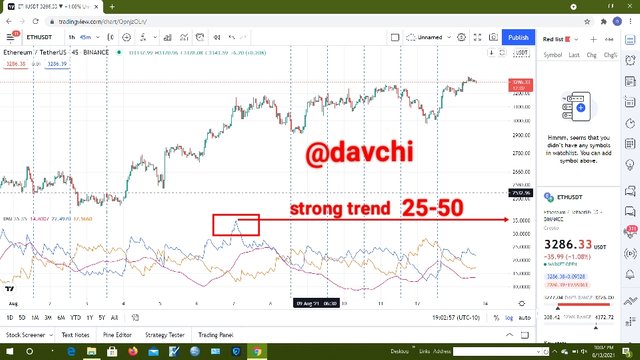
This position in the ADX signifies a strong trend as it's value is currently at 35
This is a very strong Position in the ADX and we can see it's value at the middle of 50 & 60
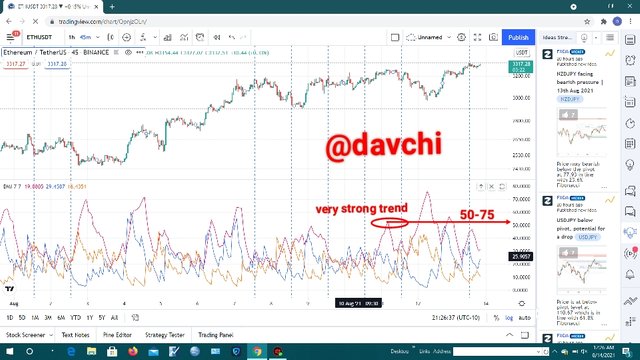
This shows an extremely strong trend as we can see it's value almost at 80
Really with just the ADX I see some reasons to absolutely rely on it as a sole indicator in placing trades as I have seen situations where it's up or down trend is in opposite direction with the chart trend.
Nevertheless, since the ADX shows the strength of a trend, it is more relaxing to dictect these false signals using the RSI and some other indicators like MACD, KDJ BOLLINGER BANDS etc.
Now we know that with the assistance of the RSI we can actually dictect and know when a trend is in it's true position as well as when a trend is approaching or have approached resistance or support level and is about retracing or reversing.
We also know that the RSI at about 70 percent or above has every tendency to reverse downwards and RSI at about 30% or below is actually about reversing up again and merging the RSI with the ADX will pretty assist in detecting false signals from a trend.
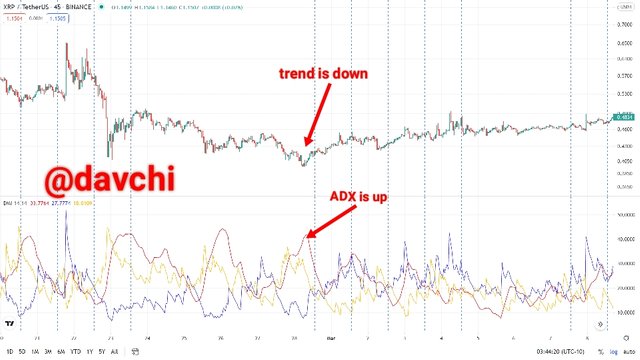
Now let's use this scenario of XRP/ usdt. From the chart above we can see that the price chart is down while the ADX is up indicating a false signal of price at the moment.
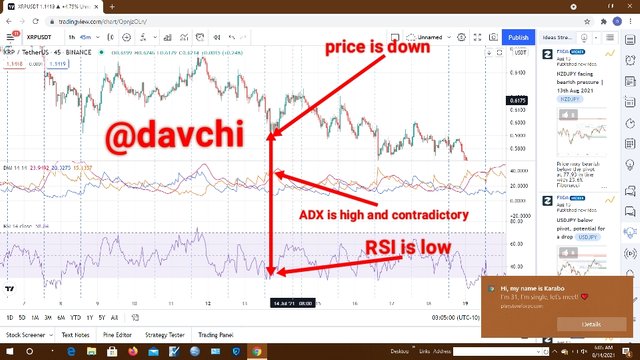
Now let's take another scenario where the RSI was inputed to clearly indicate this false signal. Here we can see the contradictory state of the trend, ADX and RSI.
The trend is actually at a low a state while the ADX is high and the RSI is also low, so if we also follow the interpretation of the RSI, we can also make a good trade although the RSI in it's own isn't without fault but it has actually helped in interpreting the real trend of the XRP / USDT chart.

5.Explain what a breakout is. And How do you use the ADX filter to determine a valid breakout? (Screenshot required)
I really believe that we are conversant with the case of up and down trend but the situation of break out is a scenario where by a price chart leaves it's trend to take another inconsistent trend probably to fill market orders of retail asset holders which could be as a result of the manipulation of the market by institutional traders, nevertheless this is not a case of resistance and support level but rather a case of absolute incongruency in price chart.
Hence there could be situations of positive and negative breakout.
The positive breakout is a price breakout which follows it's trend after it's point of break
while a negative breakout takes an opposite direction after breaking out from it's trend.
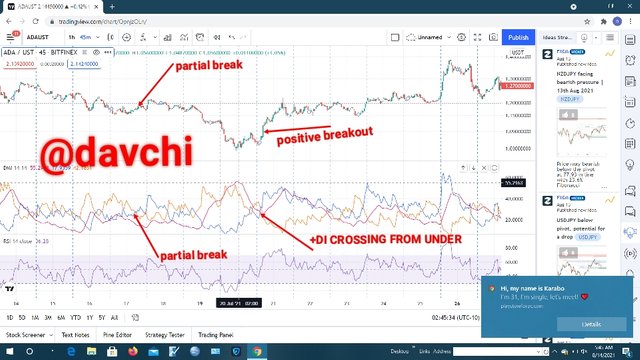
As we have now understood the situation of a breakout, let's now illustrate this in a true ADX break in the market.
From my default setting in the styles of my ADX strategy, the gray line represents -DI, the blue line represents +DI while the red line is the ADX proper.
Hence for a clear up break, the +DI must cross the -DI and the ADX from beneath and in most cases the +DI may cross either of them from beneath for and uptrend which may not necessarily be a very obvious price break but may show some significant level of uptrend, and we can see this with the illustration of ADA/USDT above
Although this also happens in a down trend scenario whereby the +DI crosses the -DI and the ADX from above as to create a down trend scenario although it could also cross either of them to create a down trend impression which may not be too strong as compared to when it crosses both of them which makes it to go abit farther than when it crosses only one of them.
ADX filtering a down trend using ADA/BTC
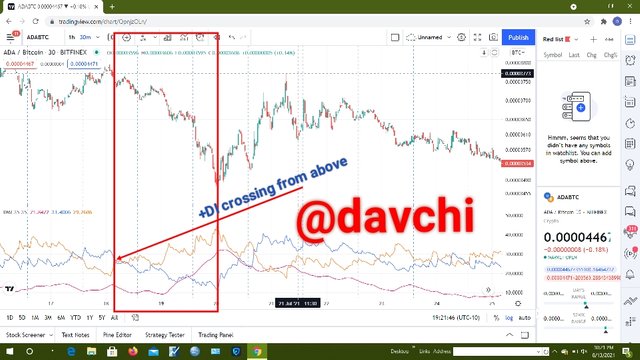
This is the case of a down trend and from the chart of ADA/BTC above we can see how the crossing of the positive DI from above the negativity DI caused a decline in price although this is also the case when the +DI crosses both the -DI and the ADX from above.
NEGATIVE BREAKOUT DETECTED BY THE ADX INDICATOR
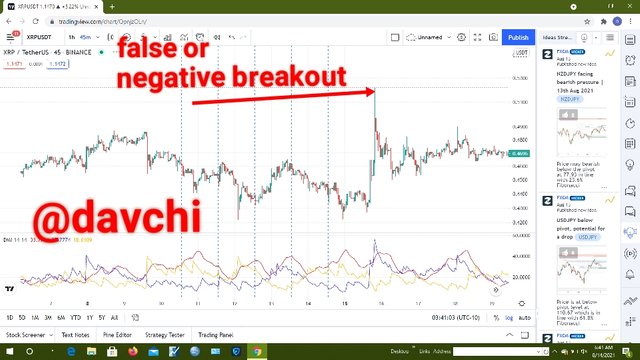
In this scenario, price breaks out of a trend and discontinues from the range of its break although this normally happens to fill retail trade orders in the technical market and also as a result of point of resistance and this also happens when the +DI has got to the very strong positions like 50. let's also take of this using ADA/USDT. In this scenario we will notice that crossing of the +DI is absolutely for an uptrend but because it has got to the point of resistance which is also a very strong Position in the use of the ADX strategy, it could not maintain that trend.

6.What is the difference between using the ADX indicator for scalping and for swing trading? What do you prefer between them? And why?
Their differences is that first let's start with scalping:
Scalping is the possibility of traders in benefitting from relative minutes prices without absolutely aiming at a very huge profit using the possible small time frames at their disposal.
Now using the ADX on its own only shows the strength of a tread possibly without a distinct direction because it's a lagged strategy in that it measures previous performance of assets. Nevertheless, merging it with the +&-DI will permit in determining the real position and true trend of the asset in question using little time frame like one minutes to 3 or 5min. respectively as to easily go out of the market immediately after some profits are made.
So the ADX allows for quick entry and exit position immediately a clear trend is indicated by the ADX strategy.
USING THE ADX FOR SWING TRADE:
First the swing trade is a concept in trade which allows for a long time trade probably to make a very huge targeted profit possibly within days weeks or months.
Now since with the conglomeration of the +/- DI, a trader can easily identify the possible trend of an asset, the ADX could be used with long time frames like 1wk or 1month to make a very high profit.
Finally the difference is that in scalping you use the indicated direction of the ADX to make quick profit using little time frame while in swing you use the ADX in seeking for a very high profit which may not be actualized using little time frames provided there is a true direction of the indicator.

The ADX indicator is actually an exquisite indicator although it is a lagging indicator in that it measures the strength of an already established trend but with the help of the positive and negative DI which shows a true direction of a trend, it has proven to be a good strategy in placing favourable trades.
Nevertheless, is is rational to use the 35 style input as to distinctly identify the true direction of a trade against entering a negative price break out as a result of the volatile nature of crypto assets.
finally it is advisable to use little time frames in placing trades while scalping and long time frames in swing trades so far the trend indication has been made or postulated by the ADX, POSITVE & NEGATIVE DI.
More attention should be given to the positive DI as it's obvious crosses gives the best possible and obvious trend indication by any asset.
Finally all screenshots were taken and edited by me as I got them from TRADING VIEW.
Thanks for patiently going through.
CC: kouba01
Hello @davchi,
Thank you for participating in the 7th Week Crypto Course in its third season and for your efforts to complete the suggested tasks, you deserve an 8.5/10 rating, according to the following scale:
My review :
An article with good content in which you answered all the questions effectively and with a clear methodology, but certain points must be mentioned.
First, I want to mention that there is a difference between the period of ADX and the timeframe used in the graph.
Also another remark, it is recommended not to exceed the range from 7 to 30 periods. As always, the lower the periods, the more entry points from which false signals can occur, and too much will jump a good portion of the trend, as there can be many cost-effective options.
A superficial explanation of two ways to trade with ADX indicator, as you confined to stating generalities without going into more details.
Thanks again for your effort, and we look forward to reading your next work.
Sincerely,@kouba01
Downvoting a post can decrease pending rewards and make it less visible. Common reasons:
Submit
Wow, thanks for going through professor, your presence is my pleasure.
Downvoting a post can decrease pending rewards and make it less visible. Common reasons:
Submit
Excellent Information my friend🤩
Downvoting a post can decrease pending rewards and make it less visible. Common reasons:
Submit
Yeah big Friend, it's really informative and pretty an indicator to trade with. Professor kouba really gave us a good exposure last week.
Downvoting a post can decrease pending rewards and make it less visible. Common reasons:
Submit
Good, sometimes I would like to see those classes from the teacher 😊
Downvoting a post can decrease pending rewards and make it less visible. Common reasons:
Submit
Yeah most of the classes are full of exquisit information but the questions are tediously engaging and for me as a student combining my book and the professor's works isn't so easy asuch.
Downvoting a post can decrease pending rewards and make it less visible. Common reasons:
Submit
Wish you the best of luck on this tour because it's appalling most times after pouring your brain to them, your work gets downrated it really breaks the heart.
Downvoting a post can decrease pending rewards and make it less visible. Common reasons:
Submit