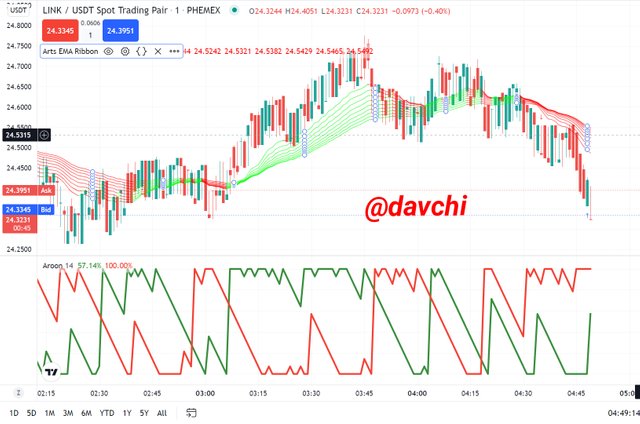
Greetings friends it's a pleasure participating in this week's S.C.A. lecture by Professor @fredquantum thanks for the beautiful lecture.

1. What is an Aroon Indicator in your own words? What are Aroon-Up and Aroon-Down? (Show them on Chart).

The Aroon indicator was invented by a technical analyst called Tushar C. in 1995 and this is a set of lines designed to investigate a certain lagged period since price has had a number of high and low periods which is set to the trader's view and preference.
This is also an indicator that helps in measuring the strength and trend of a crypto asset. We can also use this indicator in determining different reversal points in the virtual market. When the indicator reads close to a hundred, this signals a strong trend. On the other hand, when the Indicator reads close to zero we may conclude that the trend is a weak one.
I also observed that most traders use the 25 lagged period of this Indicator.
Most importantly, the Aroon-Up and Down is actually the most exquisite and fascinating aspect of this invention as their crosses, up and down motions have significant impact on possible price trends and market changes or signals, which can easily be used by any trader, even beginners.
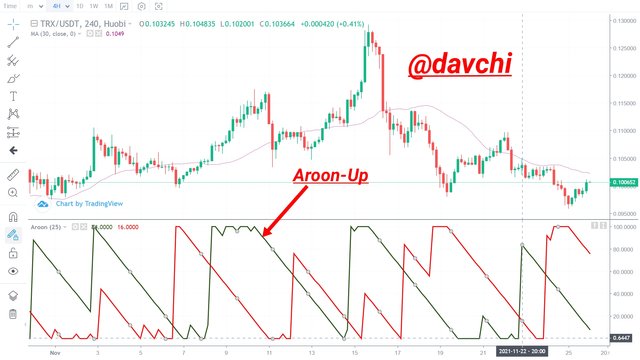
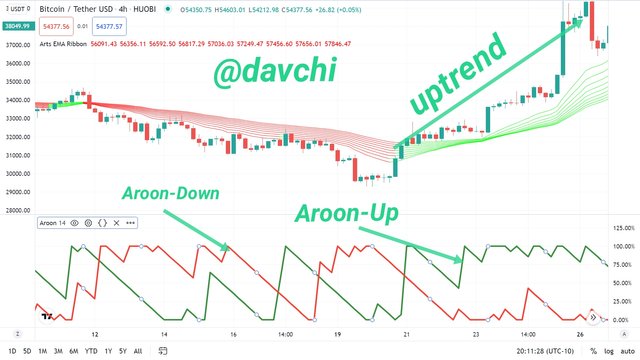
This tries to identify possible up and down-trend positions in the price of an asset although it has a more significant signal when crossing the Aroon-Down. Nevertheless the oscillating of the Aroon-Up from around 0% position of the scale upwards will signal a more bullish trend also when the Aroon-Down takes the motion from around 100% on the scale downwards, this signals a down trend.
From the screenshot above we can see using the TRX/USDT chart to observe the Aroon-Up line of the Indicator
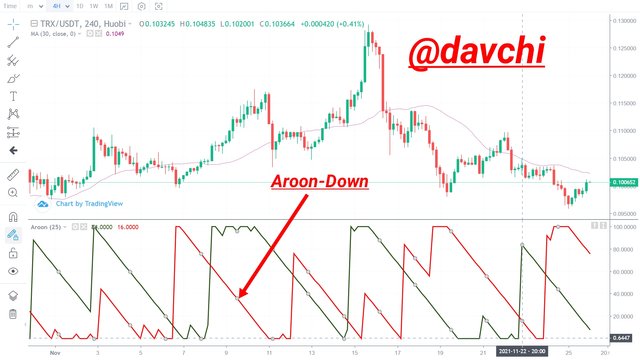
This is the opposite of Aroon-Up and it tries to signal more of a down trend than a possible up-trend. Hence the rising of the Aroon-Down from within the lower percentage upwards signals a downtrend and when it takes a downwards movement it will be followed by a probable appreciation in Price.
We can also observe the Aroon-Down from the screenshot above using the TRX/USDT price chart.
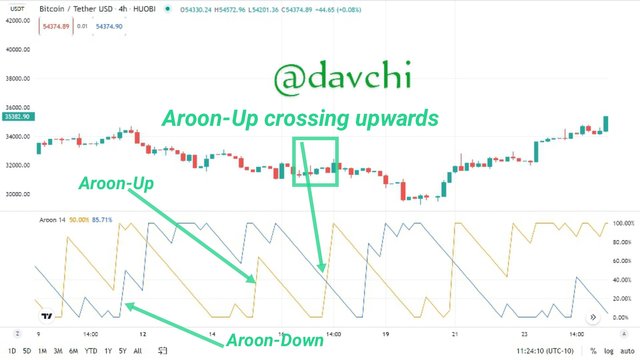
The crossing of both has a more significant impact on price action. for instance if the Aroon-Up is around 100% and then osculating downwards and on the other hand, Aroon-Down is downwards and oscillating upwards, the crossing of both of them will have a more decreasing price effect.
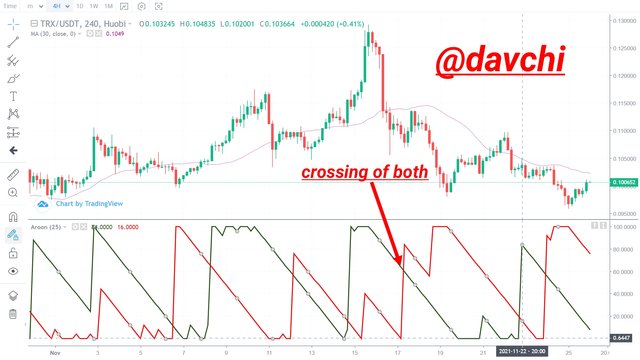
Here we cans see that the crossing of both the Aroon-Up and Aroon-Down has a significant effect in price changes as the crossing of the Aroon-Down from low position upwards signalled a down-trend as seen in the screenshot above.

2. How is Aroon-Up/Aroon-Down calculated? (Give an illustrative example).

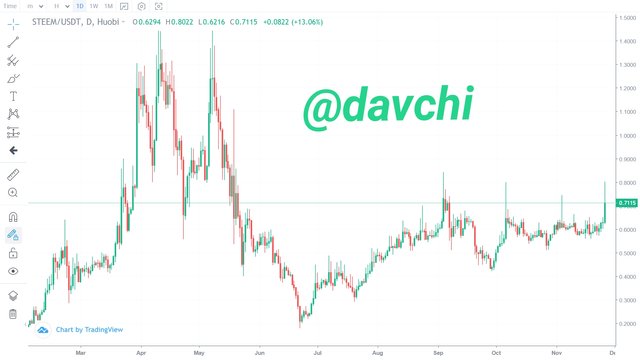
The Aroon-Up/Aroon-Down can be obtained mathematically using a possible method of equations which are expressed below. On the other hand, I will be using a crypto chart of STEEM/USDT in exemplifying this.
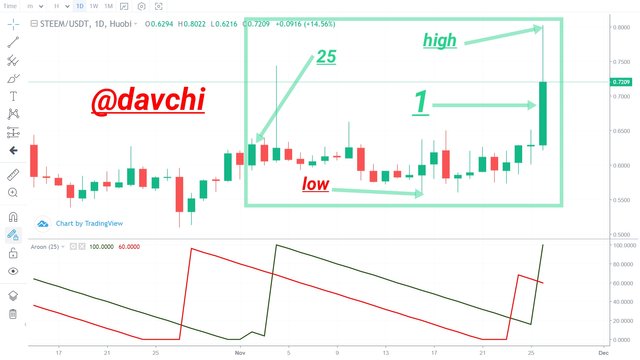
Aroon-Up Calculation.
Aroon-up = ((n - Periods Since the Recent 25 Period High) / n) × 100
And n = length or number of period
(25-1)÷25) x 100
=24÷25
=0.96 x 100
Aroon-Up= 96
Calculation of Aroon-Down.
Aroon-Down =((n - Periods Since the Recent 25 Period Down) / n) × 100
(25-11)÷25) x 100
=14÷25
=0.56 x 100
Aroon-Down= 55
Finally the Aroon indicator precisely can be evaluated as;
Aroon-Up - Aroon-Down
Aroon Indicator = 96 - 55
Aroon Indicator = 41

3 Show the Steps involved in the Setting Up Aroon indicator on the chart and show different settings. (Screenshots required).

In this regard, I will be using Huobi Exchange in setting up the Aroon Indicator in the price chart while showing its different settings. First is to log in to Huobi Exchange and it doesn't really count to get signed up before accessing this indicator on the exchange.
After logging in to Huobi I set the trading interface to Trading view, to easily view it through their platform.
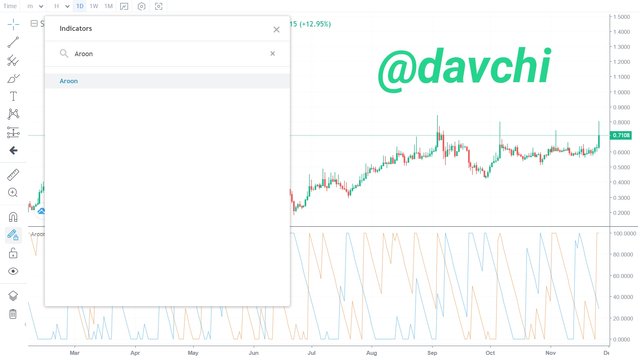
Next I click on the indicator icon at the top corner of the trading interface and search for Aroon Indicator using the type bar space provided and it is automatically inserted into my trading chart.
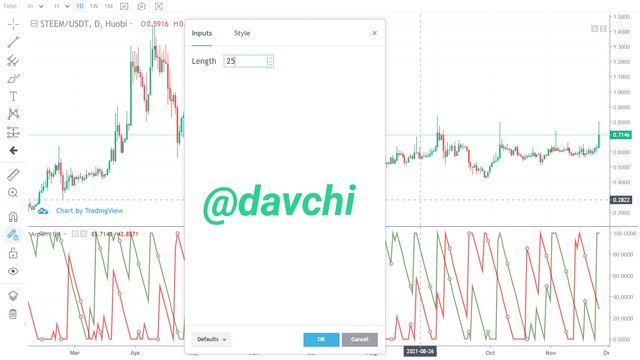
The different modification settings of this Indicator. After inserting it into the price chart, Now I will be modifying it based on my choice of trade and on the other hand if I should be trading a longer range of time I will be using a higher input length and if I decide to go on a lower time frame, I will be using a lower input length. This indicator has a default input length of 14 but I will be setting it to 25 as I observe most traders do.
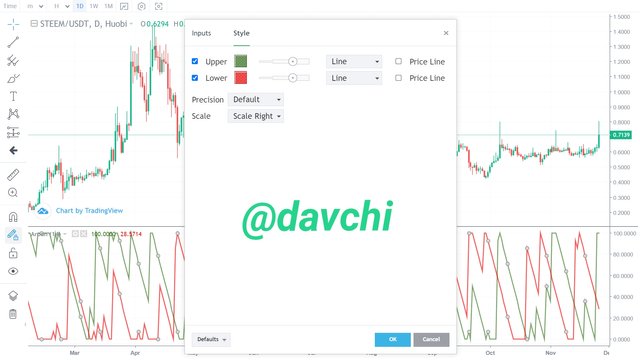
This indicator has a default style of Aroon-Up gray color and Aroon-Down blue color but I will be setting it to Aroon-Up green and Aroon-Down red which is still one of its modification styles.

4 What is your understanding of the Aroon Oscillator? How does it work? (Show it on the chart, kindly skip the steps involved in adding it).

The Aroon indicator is a technical oscillator that ranges from -100 to +100 and these two parts in the Indicator have a great effect in determining the prevailing market price. On the other hand, there is a mathematical computation that helps in determining the current value of the indicator and although shown above as we can derive this by subtraction of the Aroon-Up from the Aroon-Down. Let's consider how this indicator works on the two major trends traded which are normally in an up and down trend of the virtual exchanges.
For a strong down-trend to be confirmed using this indicator, the Aroon-Down must have gone below the zero scale position and then start taking a strong momentum swing above the zero line axis and then making a strong appearance more than the aroon-up line at the upper side of the indicator while the Aroon-Up starts taking a downward swing below the zero position of the scale.
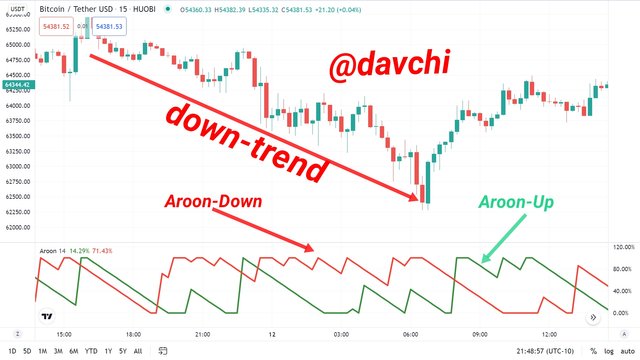
Moreso from the BTC USDT chart above we can also confirm a decrease in price as the Aroon-Down pushes upwards and taking a dominant position while Aroon-up dominates the -100 axis of the Indicator.
For this indicator to confirm a bull trend, the Aroon-Up must be making an upwards swing above the zero scale while the Aroon-Down is in a downwards position and at this point, it is profit oriented entering the market and hence to confirm a more bull trend, the Aroon-Up has to take a major dominant appearance above the 0% line on the scale.
From the BTC USDT chart above, we can confirm a bull shoot as the Aroon-Up rises from the -100 area to the +100 area of the indicator and as well taking a dominant appearance above the zero level of the Indicator.

5 Consider an Aroon Indicator with a single oscillating line, what does the measurement of the trend at +50 and -50 signify?

As earlier pointed out that when the Aroon-Up takes a bull move above the zero line it is a probable indication of an uptrend and the reverse is the case when the Aroon-Down takes the same position.
Since in this case using a single line oscillator, when the oscillator is at +50 it signifies a possible uptrend and on the other hand when it takes a down trend within the -50 axis it indicates a probable down-trend.

Using the BTC/USDT chart above, we can confirm the up and down oscillation made by the indicator at the +/-50 positions of the scale. This indicates that there is the possibility of an uptrend or a down-trend ones the indicator swings to these levels as seen on the chart above.

6 Explain Aroon Indicator movement in Range Markets. (Screenshot required).

In the case of a range market, the Aroon indicator tries to create a more open space like the Bollinger bands. Hence both the Aroon-Up and Aroon-Down tend to oscillate and take a more same directional movement in a right sideways manner until a true trend is signaled.
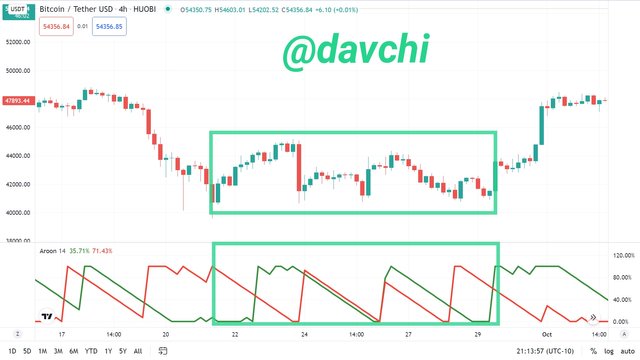
For instance, using the BTC/USDT price chart above we can see that in the identified rectangular boxes there isn't a more observed opposite movement of the Aroon-Down and Aroon-Up lines to confirm a possible direction of the price chart which is a confirmation of a range market.

7 Does an Aroon Indicator give False and Late signals? Explain. Show false and late signals of the Aroon Indicator on the chart. Combine an indicator (other than RSI) with the Aroon indicator to filter late and false signals. (Screenshots required).

It is factual that there is no absolute reliable indicator when it comes to trading as there are also other contingencies that can contribute to the stability or instability in an asset. Nevertheless the same also applies to the Aroon indicator as it can also produce false and late signals since it is a lagging Indicator meaning that it tries to calculate previous price actions and not a possible future price action.
The crossing of the Aroon Indicator that is the Aroon-Up and Aroon-Down has a significant impact on price. For instance the crossing of the Aroon-Down from the negative side of the Indicator above the Aroon-Up to the +100 axis will lead to a possible down-trend while the crossing of the Aroon-Up from the negative side of the Indicator above Aroon-Down to the +100 axis will a strong downtrend but this is not always the case as there crossingay not confirm the above theory.
On the other hand, there are certain market scenarios where the price chart is in an up trend while the Aroon-Up is still below the 0 axis and the same applies to Aroon-Down and in this case we can attest that there is a delay in price Confirmation. Let's see these in the Indicator using the below price chart.
We believe using this Indicator that the upwards shoot of the Aroon-Up from within the -100 area across the Aroon-Down to the +100 will lead to price increase but in the price BTC/USDT chart above, we can observe that there was no real price appreciation despite the strong momentum exerted by Aroon-Up to cross over to the +100 area there was still no appreciable price movement.
Art EMA Ribbon
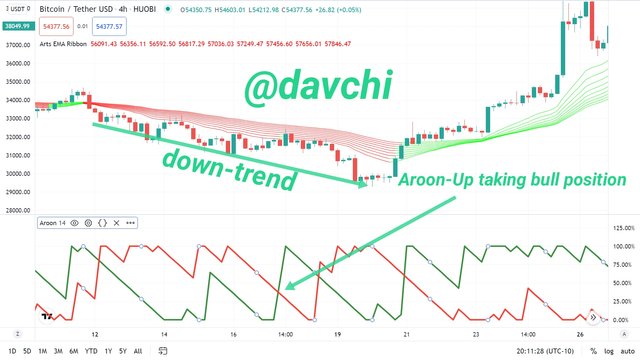
With the inclusion of the Art EMA Ribbon tool to this indicator we are now able to dictate that this is a real down-trend and despite the pressure that can be mounted by the Aroon-Up to push up it may not take price to an appreciable height as confirmed in the BTC/USDT chart above.
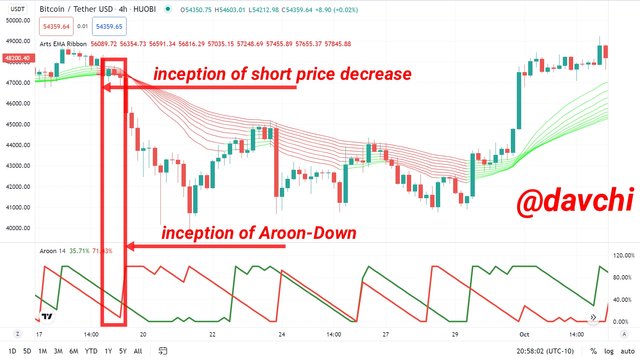
The Aroon Indicator also gives a late signal in price movement as most times the significant crosses of the Aroon-Down and Aroon-Up may not conform with possible price direction.
Using the BTC USDT chart above we can also confirm the late signal made by the Aroon-Down oscillator when the Art EMA Ribbon has already taken a decreasing price movement.

7 State the Merits and Demerits of Aroon Indicator.

- The Aroon Indicator helps in dictating possible price signals as the crosses of Aroon-Down and Aroon-Up have significant impact on price movement.
- The mathematical application of this indicator can aid in dictating and analysing the possible high and low periods that have traded in the virtual market within a particular period in view.
- The rising of the Aroon-Up oscillator can aid a trader in making significant market entry that can yield profitably to the increment of his portfolio.
- Possible rising of the Aroon-Down oscillator can assist in taking an exit position for a spot trader and possibly an entry position for a future trader.
- The dominance of either the Aroon-Up or Aroon-Down in the upper side of the indicator is a show of either increasing or decreasing price dominance and can aid users in maintaining their trade within the oscillating signal support.

- We agree to the fact that there is no absolutely perfect indicator in the world and therefore the sole use of this indicator can lead to some trade losses.
- Most of the rising of the Aroon-Down and the falling of the Aroon-Up does not institutionalize a down trend or possible price decrease despite going above the zero degree of the indicator.
- The mathematical calculation of this indicator does not have any significant impact in dictating or predicting future values of an asset since it only puts into consideration the lagged value of the asset in view.
- Most rising of the Aroon-Up doesn't confirm price increase there by faking possible entry positions where traders who have entered the market may be losing a reasonable portion of their asset.
- Traders who may be solely relying on this indicator for trades may face certain delay challenges with regards to trend confirmation by the indicator as they may lose important entry or exit points while waiting for the Indicator to signal the possible trend

8 Place at least one buy and sell trade using the Aroon Indicator with the help of the indicator combined in (7) above. Use a demo account with proper trade management. (Screenshots required).


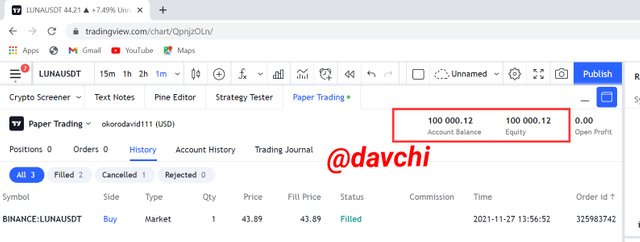
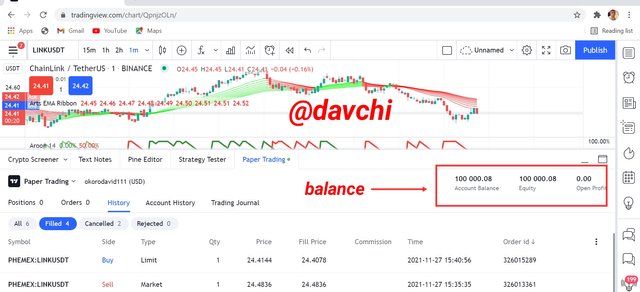
My account balance before the buy order
Source
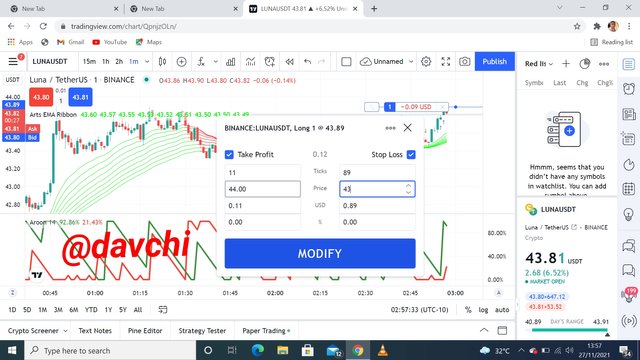
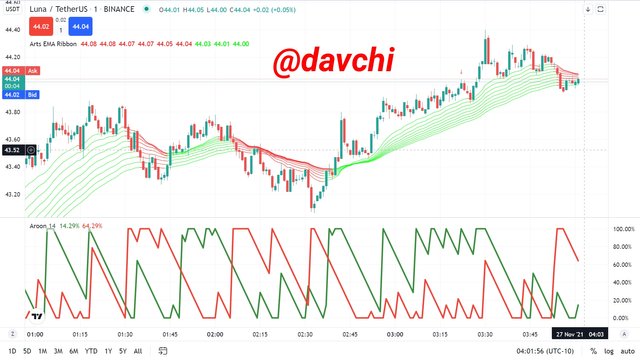
With the merging of the Art EMA Ribbon with the Aroon Indicator and noticing a bull market in the Luna Asset, I set in for a buy order, set the take profit and stop loss positions and then initiated the buy order.
Finally, the order initiated was automatically filled as I exit the market
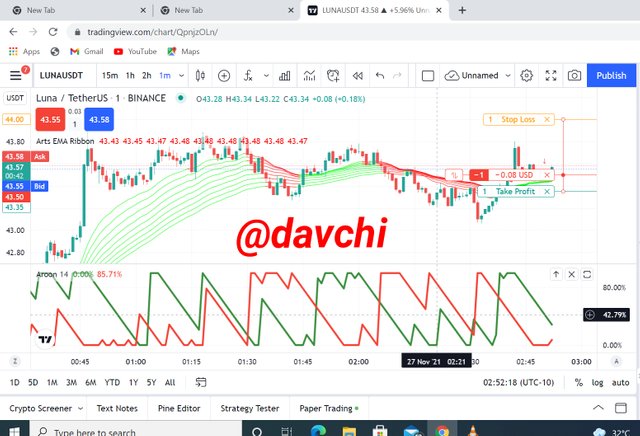
The price chart after filling the order although my system went off on the course of waiting for the filling of the order which was actually the reason I took the screenshot at this point.

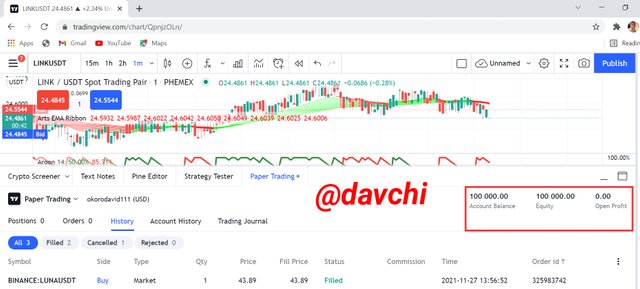
My account balance before setting into the market for a sell order
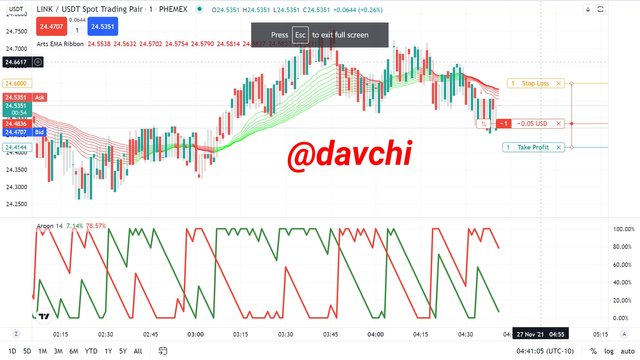
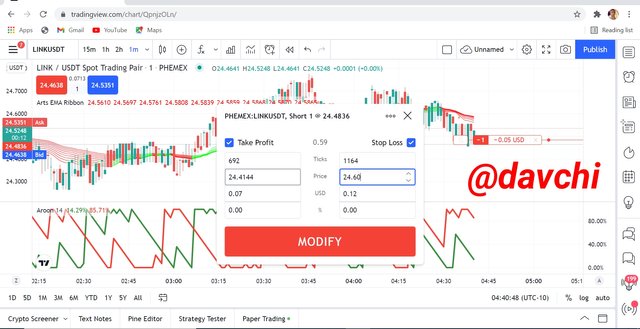
With the amalgamation of the Art EMA Ribbon and the Aroon Indicator, I also placed a sell order using the LINK asset, setting possible stop loss and take profit position and finally the order was filled at hitting the take profit region.
Source
Setting the take profit and stoploss positions
Order inserted into the price chart
Order filled as set into the asset above
My little accumulated balance after trade

The Aroon Indicator is one of the exquisite indicators I have ever come across as it can be easily used although with prudence despite market fluctuations, it still tries to give some accurate signals which can aid profitability. Nevertheless we still believe that there is no indicator without some lapses but the merging of the Aroon Indicator with other indicators can aid a high level of profit to any trader whether a beginner or a professional thanks.
Cc: @fredquantum
