It feels so good learning about liquidity levels in this weeks academy courses. special thanks to Prof @cryptokraze.
1. What is your understanding of the Liquidity Level
Before I talk about Liquidity level, I will love to talk explain briefly what liquidity is.
Liquidity is the rate at which assets are traded in the financial market. These assets could be stock, cryptocurrencies, foreign exchanges etc. liquidity rate is therefore influenced by has fast or how slow the asset orders are taken in the financial market.
Liquidity Levels are swing points on the price chart of an asset. Swing points are reversal points which is as a result of how traders are trading that asset. The liquidity level is usually taken either above or below the resistance and support levels. These levels occur as a result of manipulations by whales in the market to trick traders with small capital while they (the whales) are taking profits.
Liquidity levels are seen as price fakeouts. Fakeouts are quick reversal in the upward or downward movement of price to the to the opposite direction.
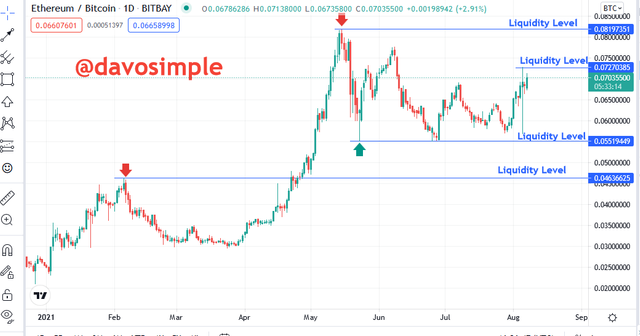
ETH/BTC 1D Chart
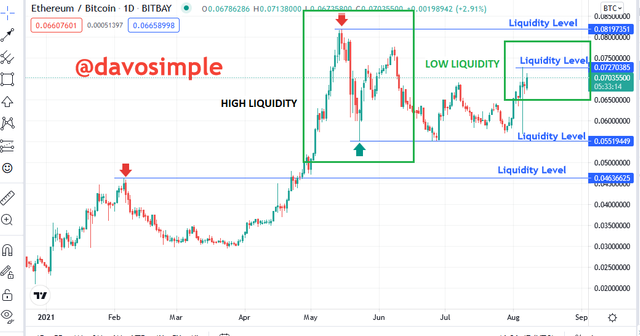
ETH/BTC 1D Chart
The screenshots above are chart of pairs of ETHUSD showing the marked liquidity levels of both high and low. The high liquidity shows that there were high trading rate at that point. The low liquidity level shows that there were low trading volume at that moment.

2. Explain the reasons why traders got trapped in Fakeouts. Provide at least 2 charts showing clear fakeout.
Fakeout is a term used by technical analysts to describe scenerios where price move against the desired direction of a trader. Assuming a trader was anticipating an uptrend after his analysis, the trader enters a buy position then suddenly, the price swings to the opposite direction, thereby causing some considerable loss for the trader.
This trick is engineered by the whales (big capital investors) so that they can take profits from the loss of the small capital investors.
ETHBTC 4H Chart
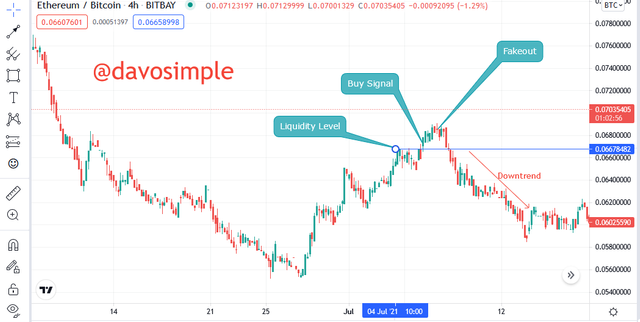
From the chart above, it is seen that a buy signal was formed. As a trader saw this signal, he entered a buy position and all of a sudden, the price reversed to the opposite direction which is the sell. This trick was actually engineered by the whales to get more small capital investors to fall in so they can close their positions and take profits after they saw that there was enough demand in the market.
ETHBTC 4H Chart
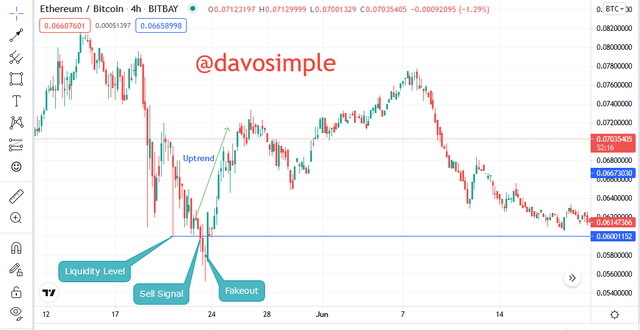
This is a chart of ETHBTC showing another liquidity level where the price showed a sell signal but reversed to the opposite direction. The whales here saw that there was enough supply in the market, so they decided to take the price to the opposite by closing the sell position after so many small capital investors had opened a sell position. This also is a trick by whales to take advantage of the loss of the low capital investors.

3. How you can trade the Liquidity Levels the right way? Write the trade criteria for Liquidity Levels Trading
Liquidity levels can be traded the right way using some strategies. These strategies always reveal the movement of price in a particular direction and helps the trader to get a confirmation before entering a trade. Two strategies have been of great help to traders, and these strategies are;
Market Structure Break (MSB)
Break Retest Break (BRB)
Using MSB
The following thumb rules are always helpful for both entry and exit if applied properly while trading liquidity levels.
Entry Criteria
Price must be seen moving towards the direction of the liquidity level and either touches the liquidity level or give a fakeout and then bounce to the opposite direction
Price should be seen making higher highs and higher lows, lower lows and lower highs for each corresponding trend.
Wait and confirm a clear neckline break before entry
Enter a trade after confirmation
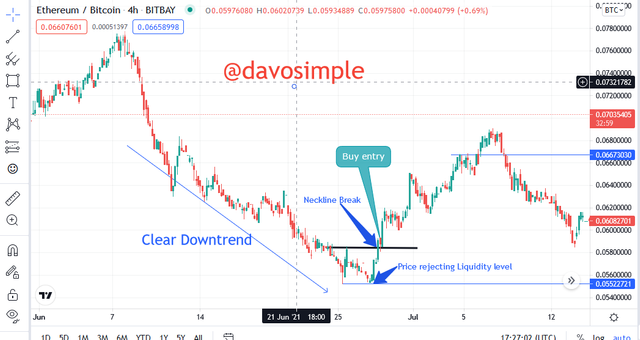
MSB Buy Entry
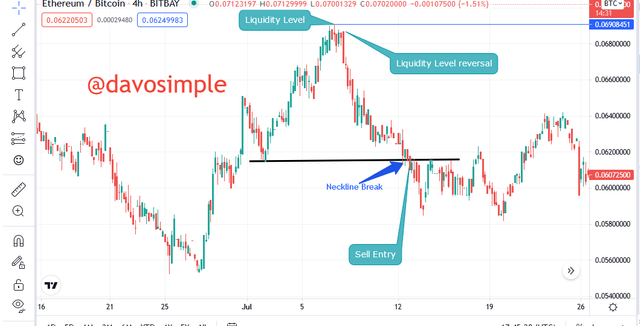
MSB Sell Entry
Exit Criteria
Stop Loss should be used should incase the trade moves in the direction that opposes our desire.
Take profit should be set should incase the trade goes in our desired direction.
1:1 risk reward ratio is ideal to have a balanced trade, but the risk reward ratio could be tweaked depending on the experience of the trader.
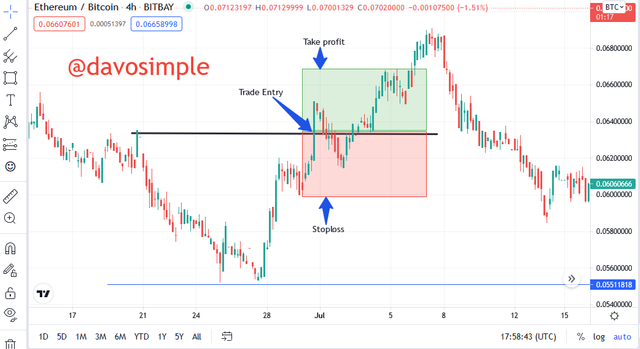
MSB Buy Exit
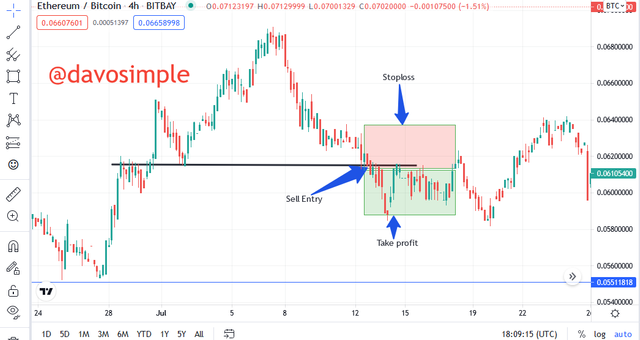
MSB Sell Exit
Using BRB
Entry Criteria
Liquidity level of the price should be noted and marked.
Wait and see if the price respects the liquidity level, if it doesn’t then draw a support and resistance line. If price is seen breaking above or below the resistance or support line, then wait for a retest of the level if it has been broken by the price.
Allow price to break the resistance to confirm an uptrend or to break the resistance to confirm downtrend.
Then enter a trade position
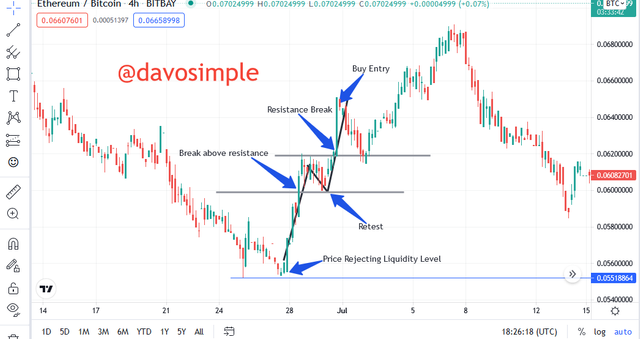
BRB Buy Entry
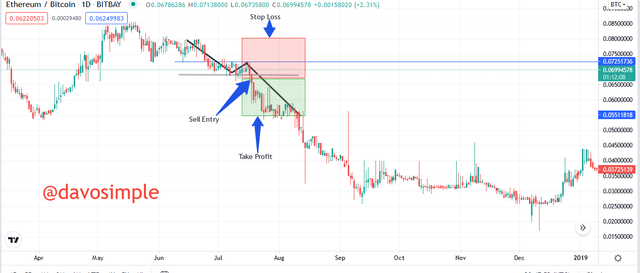
BRB Sell Entry
Exit Criteria
Apply stop loss above or beneath the swing level(s) should the trade boomerangs against the trader.
Take profit should be set should incase the market moves in the desired direction.
1:1 risk reward ratio is ideal to strike a balanced trade.
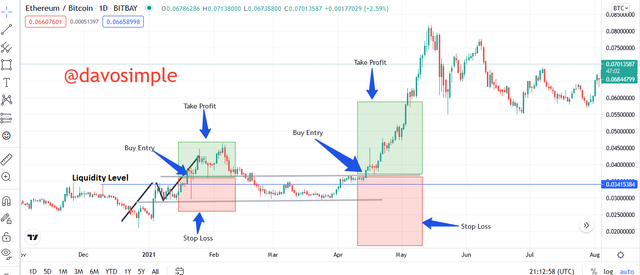
BRB Buy Exit

BRB Sell Exit

4. Liquidity Levels Trade Setup On 4 Crypto Assets
I will be answering this question with the following assets;
ETHUSDT Setup
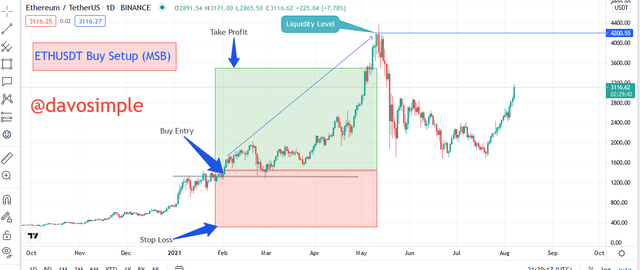
For this chart, i used the MSB strategy to trade liquidity level.
STEEMBTC Setup
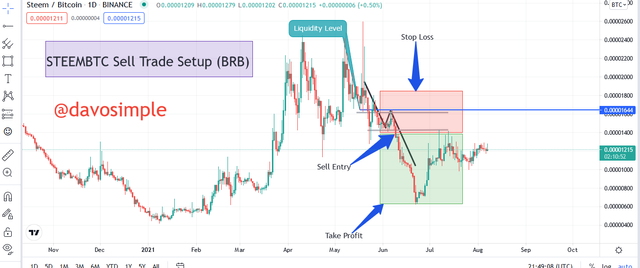
For this chart, i used the BRB strategy to trade liquidity level.
ADAUSD Setup
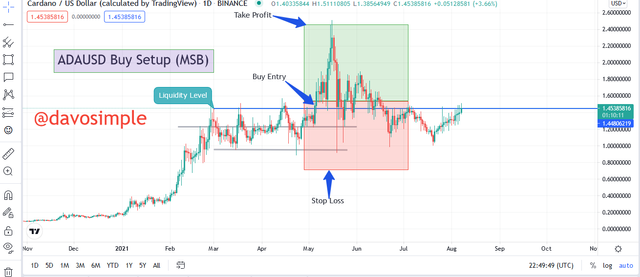
For this chart, i used the MSB strategy to trade liquidity level.
ETHBTC Setup

For this chart, i used the BRB strategy to trade liquidity level.
Conclusion
Liquidity Levels are tricks used by the whales to manipulate the market price of asset so they can take advantage of the trend. This trick has made so many low capital investors lose out of their trading positions.
liquidity levels can actually be traded if a trader understands how to make use of the MSB and the BRB strategy effectively.
Thanks for reading through work.
cc:
Prof. @cryptokraze