Hello great minds, i am glad attending this week's lecture by Prof. @cryptokraze which opens my trading understanding more with the sharkfin pattern trading strategy.
1. My Understanding Of Sharkfin Pattern
Sharkfin pattern is a pattern in trading where price quickly swings and move in the opposite direction. This pattern is one of the easiest and safest trading strategy employed by traders to ride trends. This is to say that the sharkfin trading strategy works both for uptrends and downtrends.
One beautiful thing about the sharkfin pattern is that it works very well in almost every time frame. It is seen in uptrends and downtrends as a result of high trading volume triggered by financial institutions to pull in more traders to open trading positions.
This pattern is identified as inverted V shape in uptrends and as V shape in downtrends.

The screenshot above is a 30 minutes chart of ETH/USD pair showing sharkfin pattern as a result of quick price reversal in uptrend. At that point when the reversal occurred, the trading volume increased, showing that there were so many traders who were trading at that moment. Price reversed and changed its direction from uptrend to downtrend, leaving a swing point. That swing point has an inverted V shape to show a sharkfin pattern.

The screenshot above is a 30 minutes chart of ETH/USD pair showing sharkfin pattern as a result of quick price reversal in downtrend. The trading volume also increased at that point, meaning that so many traders were trading at that moment. Price reversed from downtrend to uptrend, leaving a swing point. That swing point has a V shape to show a sharkfin pattern.

2. RSI Indicator To Spot Sharkfin Pattern
The sharkfin pattern is a very interesting trading strategy which is very easy to understand. But even with its simplicity, there are some tools which are very ideal in identifying and spotting true sharkfin patterns to avoid getting trapped by the false resistance or support break outs.
Some of these confirmation tools include the moving averages (50MA, 20MA and 800MA though not limited to these three MAs, depending on which works best for the trader), the volatility bands (Bollinger Bands) and the RSI (Relative Strength Index). Combining two or all of these tools is called a confluence, and it gives the trade some more accuracy while trading the sharkfin pattern.
Sharkfin patterns can be traded with just the RSI, and it is the only tool I will be talking about in this task.
RSI indicator helps a whole lot in identifying sharkfin patterns on charts. Maintaining the default setting of length = 14, bands = 30 and 70 of the RSI indicator is an ideal way of spotting the sharkfin patterns.

Whenever the RSI line breaks below the 30 level mark and then bounces back to the opposite direction and breaks above the 30 level, forming a V shape at the swing point, it is a good indication of the sharkfin pattern, and a trader can open a buy position.

When the RSI line breaks above the 70 level and then bounces back to the opposite direction and breaks below the 70 level to the downward direction, forming an inverted V shape at the swing point on the chart, then it means that a sharkfin pattern has occurred, and a trader can open a sell position.

3. Trade Entry And Exit Criteria Sharkfin Pattern
The following are trade entry and exit criteria for both buy and sell while trading with sharkfin pattern.
Sell Entry Criteria
A sharkfin pattern confirmation tool such as RSI should be added to the chart
During clear uptrend, price should be seen bouncing back to the opposite direction, forming an inverted V shape.
RSI must have broken above the overbought level which is the 70 level mark and then make a quick reversal breaking below the 70 level mark forming a shape like an inverted V on the chart.
As RSI line clearly crosses below the 70 level mark to the downward direction, then a sell entry position is due to be opened.

Buy Entry Criteria
A sharkfin pattern confirmation tool such as RSI should be added to the chart
During clear downtrend, price should be seen bouncing back to the opposite direction forming a V shape.
RSI must have broken below the oversold level which is the 30 level mark and then make a quick reversal, breaking above the 30 level mark to the upward direction, forming a V shape on the chart.
As RSI line clearly crosses above the 30 level mark to the upward direction, then a buy entry position is due to be opened.

Sell Exit Criteria
Since we can never catch all the trends in the market, it is ideal to set stop loss should incase the trade doesn’t go in the desired direction
The stop loss should be placed right above the inverted V shape which is the sharkfin pattern
There is a greater amount of possibility of the trade always going in the favor of the trader if the trader understands the pattern well. Therefore, take profit level should also be set.
Risk:Reward (R:R) ratio of 1:1 is ideal for beginners who are yet to get enough experience with the sharkfin pattern.
Then close trade with profit after the trade gets to the take profit level.

Buy Exit Criteria
Since we can never catch all the trends in the market, it is ideal to set stop loss should incase the trade doesn’t go in the desired direction
The stop loss should be placed right below the V shape which is the sharkfin pattern
There is a greater amount of possibility of the trade always going in the favor of the trader if the trader understands the pattern well. Therefore, take profit level should also be set
Risk:Reward (R:R) ratio of 1:1 is ideal for beginners who are yet to get enough experience with the sharkfin pattern.
Then close trade with profit after the trade gets to the take profit level.


4. Two Trades Based On Sharkfin Pattern Strategy

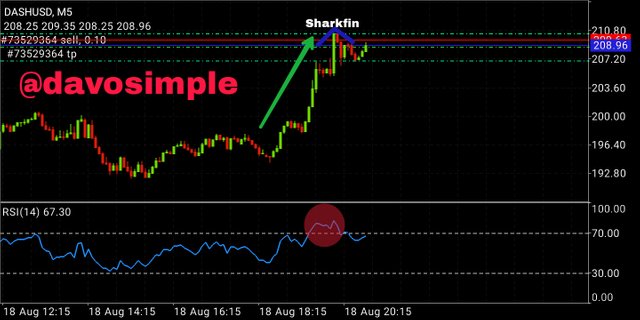
The screenshot above is a 5 minutes chart of DASH/USD pair. I waited for the price to move in a clear uptrend. Then I noticed a quick swing, then price changed its direction to the downtrend. I also watched if the RSI line had also broken above the 70 level of the indicator and reversed back, breaking the 70 level to the downward direction. That was a good sell entry confirmation for me, then I opened a sell position.
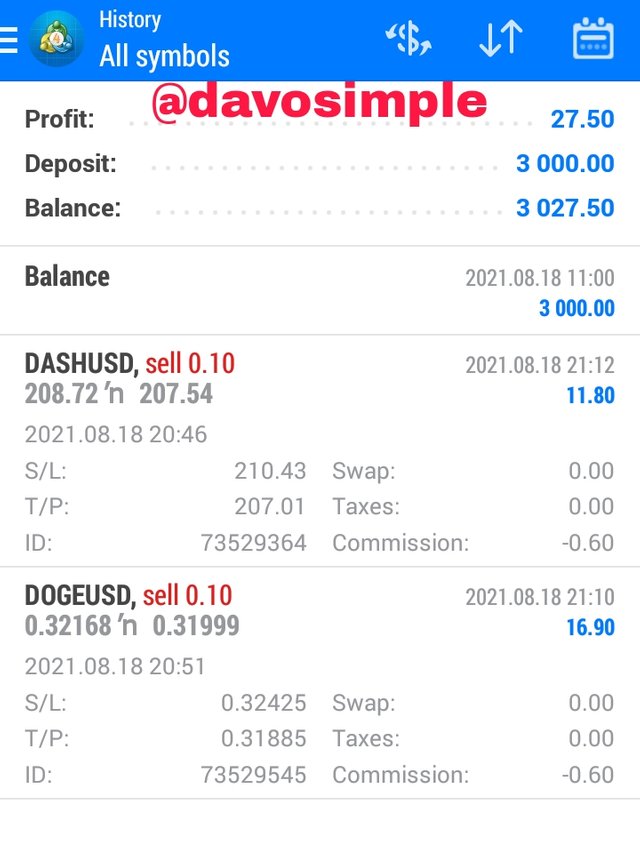
My stop loss and take profit were set at the ratio of 1:1

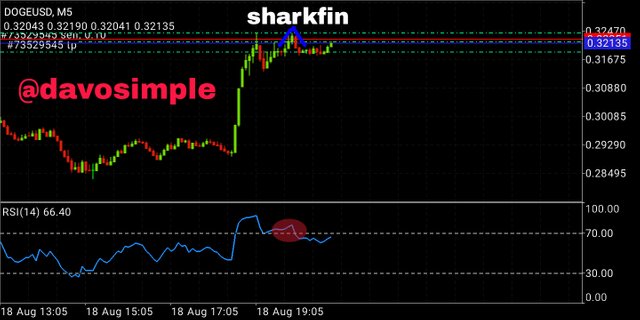
The screenshot above is a 5 minutes chart of DOGE/USD pair. I waited for the price to move in a clear uptrend. Then I noticed a quick swing, then price changed its direction to the downtrend. I also watched if the RSI line had also broken above the 70 level of the indicator and reversed back, breaking the 70 level to the downward direction. That was a good sell entry confirmation for me, then I opened a sell position.
My stop loss and take profit were set at the ratio of 1:1

The trade was placed using the MetaTrader 4.

Conclusion
One of the simplest and easy to understand strategy of trading is the sharkfin pattern. The strategy works perfectly in almost all time frames and it helps traders to spot good entry positions, thereby riding the trend in a profitable way. It works perfectly in both the uptrend and the downtrend direction.
The sharkfin pattern, even though is easily understandable still needs the employment of some good confirmation tools which RSI indicator is one of the best tool to use.
With the RSI added to the chart, trade execution becomes simply seamless.
Thank Prof. @cryptokraze for the wonderful lectures.
Downvoting a post can decrease pending rewards and make it less visible. Common reasons:
Submit