hello everyone, it is pleasure being a part this week's lecture given by Pro. fredquantum about Keltner channel indicator. Below is my input.
1. Creatively discuss Keltner Channels in your own words.
Being much aware of how the crypto market is volatile, this volatility most times are determined by some tools. One of the tools i popularly known which can be used to determine the volatility in the crypto market is the Keltner Channel.
The Keltner Channel is simply an indicator that let's a trader know how volatile the market is at a moment and also help to know the direction of a trend and the possible continuity of the trend.
The Keltner Channel was first brought to lime light by Chester Keltner in the 1960s. The indicator when first introduced was known to use the Simple Moving Average to determine the market volatility but the recent version of the indicator makes use of the Exponential Moving Average to determine volatility of an asset over time.
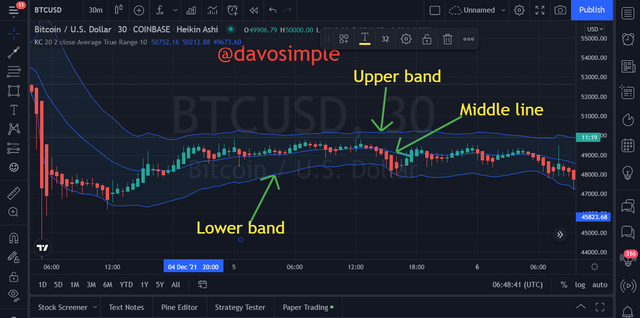
This indicator consists of three useful lines which are the mid-line, which is by default set to 20 period exponential moving average. The two lines guarding the mid-line are equidistant from the middle line and they are separated from the mid-line at a distance determined by twice the Average True Range (ATR) value. These two lines which are found at the bottom and at the top of the middle line are seen by most traders as the support and resistance level.
When the volatility of the market is high, the top and bottom line of the Keltner indicator expands and when the volatility in the market is low, the top and bottom line of the Indicator contracts.
The Keltner Channel indicator functions in a similar manner like the Bollinger bands, adjusting to changes in price as a result of volatility in the market, but there are key differences which i will talk about in the latter part of this post.

2. Setup Keltner Channels on a Crypto chart using any preferred charting platform. Explain its settings. (Screenshots required).
I will be showing how to add the Keltner indicator to a chart using the Tradingview site.
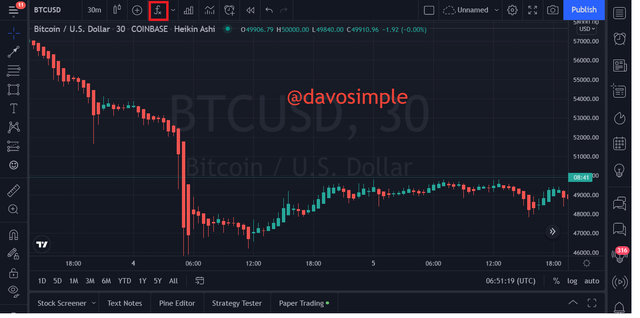
On the chart of my preferred crypto asset, i clicked on Indicators
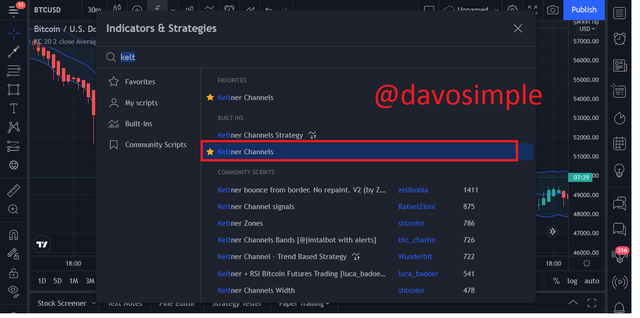
Then i searched for Keltner Channel and clicked on it
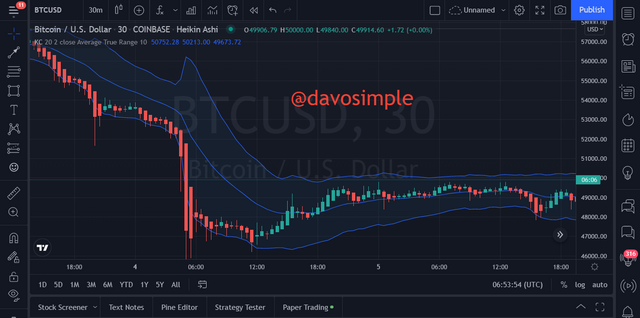
The indicator is successfully added to the chart.
The Settings of the Indicator
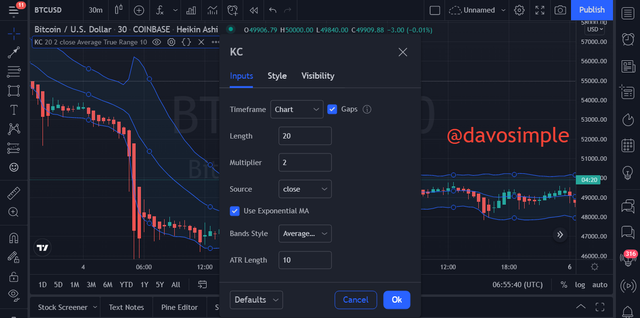
To access the settings parameters of the Indicator, i clicked on the settings icon highlighted above.
The first category of settings is the Input. This consists of the following;
Timeframe: This function determines the timeframe which the Indicator should work with. By default, it is set to function in the same timeframe as set on the chart.
Length: This is the number of days or number of periods covered by the Indicator. It is by default set to 20 period.
Multiplier: This is a multiple of the spacing between the mid-line and the top and bottom bands.
Source: This is used to determine what price the Indicator should focus on. If it should be the open price or the closing price.
Exponential Moving Average: This box, when ticked sets the center line as EMA and if it is unticked make the center line to become SMA.
Bands Style: This option let's users configure the type of bands they wish to employ on the chart. It is by default set to ATR
ATR Length: This is the number of days which the ATR works with to have a standard band. It is by default set to 10
Style
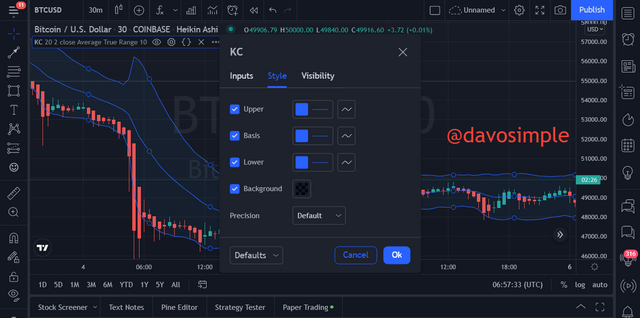
This feature let's users configure appearance of the Indicator on the chart to their preference. On the style interface, users can configure the colors of the upper band, lower band, basis, and background to their own preferred color.
3. How are Keltner Channels calculated? Give an illustrative example.
The calculation of the Keltner indicator is not really a laborious task. It is easy and straight forward.
The formula for calculating the Keltner indicator is;
Centre Line = 20 period EMA (default)
Upper Line = EMA + (2 x ATR)
Lower Line = EMA - (2 x ATR).
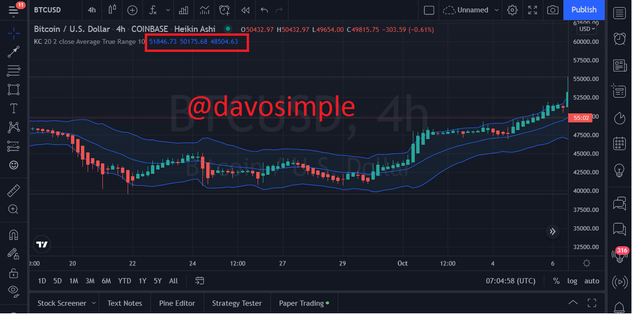
From the screenshot above, the center line is 50,175.68, Upper band is 51,846.73 and the lower band is 48,504.63.
To calculate the Keltner channel,
Upper band = 51,846.73 + ( 2 x 10)
Upper band = 51,866.73
Lower band = 48,504.63 + ( 2 x 10)
lower band = 48,524.63
4. What's your understanding of Trend confirmation with Keltner Channels in either trend? What does sideways market movement looks like on the Keltner Channels? What should one look out for when combining 200MA with Keltner Channel? Combine a 200MA or any other indicator of choice to validate the trend. (Separate screenshots required)
Trend confirmation is one of the ideal and basic importance of using indicators on a chart. The Keltner Channel indicator allows a trader to confirm when the market is in an uptrend, downtrend or in a range.
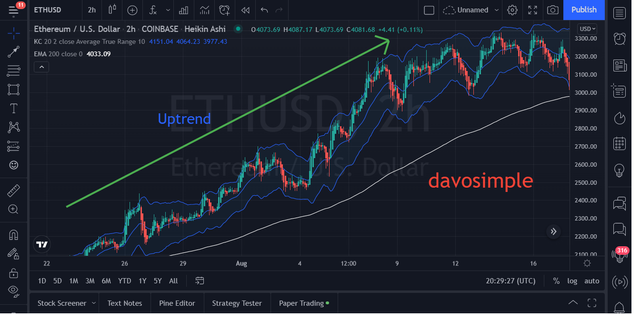
Uptrend
When the Keltner Channel indicator begins to make some upward move and then some candles are engulfed by the upper band and the middle line, then it is a confirmation that the market is in an Uptrend. The engulfing upper and middle line serves as dynamic support and resistance.
Above is a screenshot showing price action engulfed by the upper band and the middle line of the Keltner Channel, confirming that the current market is in an uptrend.
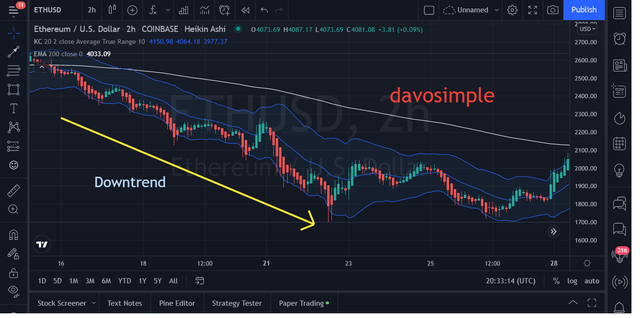
Downtrend
If the Keltner Channel indicator is moving in the downward direction and the price is seen engulfed by the middle line and the lower band, then it is a confirmation of a Downtrend. The engulfing lines functions as dynamic support and resistance.
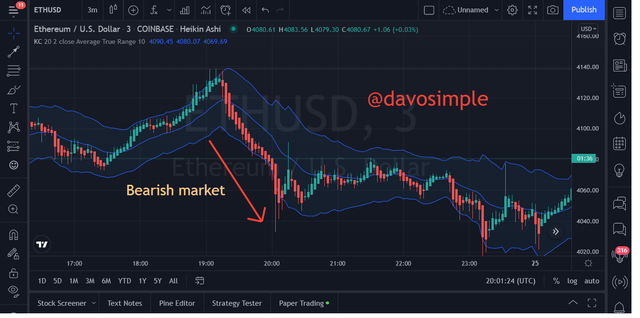
Above is a screenshot showing price action engulfed by the lower band and the middle line of the Keltner Channel, confirming that the current market is in a downtrend.
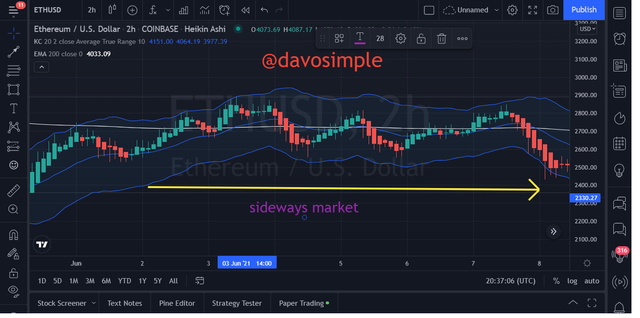
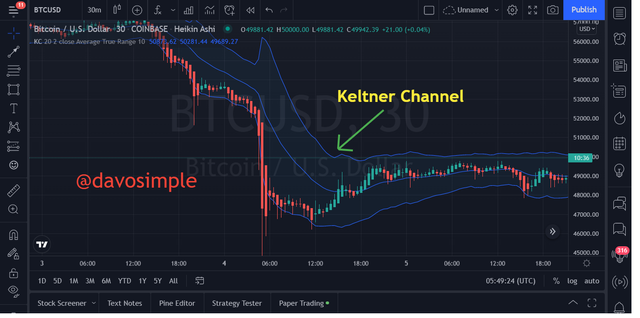
Sideways Market
Sideways Market is simply a non trending market. That is, the market is neither going up or going down, instead, it is just ranging.
This type of market is caused by less involvement of traders in the market at a particular moment which also means that the volatility at that moment is relatively low.
The Keltner Channel indicator helps to identify this type of market by contracting it bands. Price action enveloped by the Keltner Channel will be seen dancing within the upper and lower band of the Indicator.
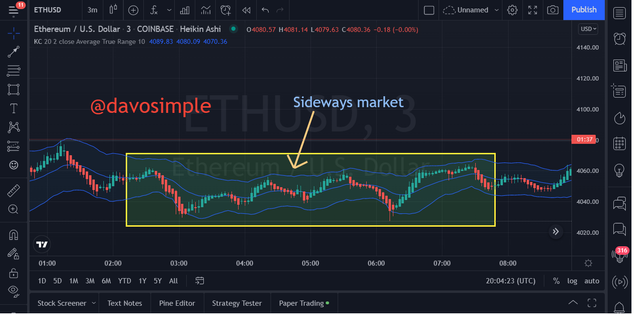
Here is a screenshot showing the behavior of the Keltner Channel indicator in a ranging market.
What to look out for when combining 200 MA with Keltner Channels
The Moving Average set to 200 period can help increase the winning rate of trades. This tool can be used to have a get a double confirmation before opening a position.
To identify a bullish trend, the 200 MA should be seen clearly below the price action and also apart the Keltner Channel indicator. That way, identifying a strong bullish trend can be certain
To identify a bearish trend, the 200 MA should be seen right above the price action and also apart the Keltner Channel indicator. That way, identifying a strong bearish trend can be certain.
For a ranging market, the 200 MA should be completely running on the price action. That way, traders can know that the market at that moment bis very less volatile.
Combination of the Keltner Channels with a 200 MA or another indicator
I will combine the Keltner Channel indicator with the 200 MA to get a good trend confirmation.
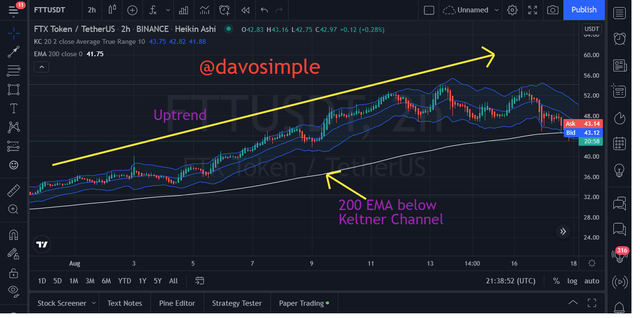
From the screenshot above, we can visualize how price action is seen making swing highs in-between the middle line and the upper band of the Keltner Channel indicator. The 200 MA also confirmed the signal by moving below the Keltner Channel indicator.
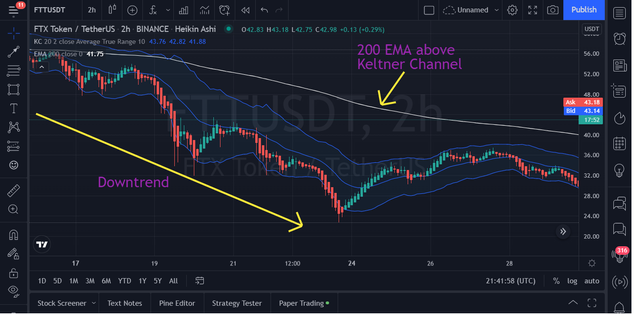
Here is another screenshotshot of price action making swing lows below the betwixt the middle line and lower band of the Keltner Channel indicator. The 200 MA also confirmed the signal my moving right below above the Keltner Channel indicator.
5. What is Dynamic support and resistance? Show clear dynamic support and resistance with Keltner Channels on separate charts. (Screenshots required).
In the financial market, it is certain that price can never go up all the time and can never be seen going down all the time.
There are points where price most times always respect, and make a reversal. Those points which price couldn't break above or below are know as dynamic support and resistance.
The Keltner Channel indicator has its upper and lower bands which serves as dynamic support and resistance, therefore letting a trader take good decisions before taking a trade.
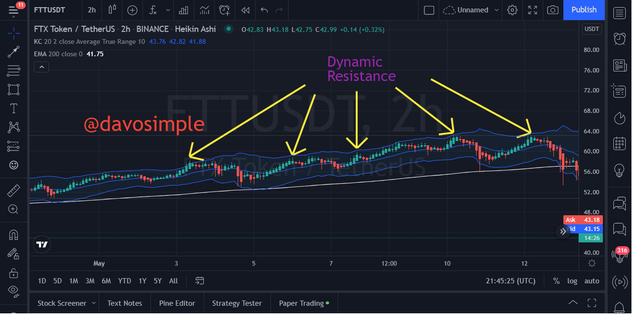
Up here is a screenshot showing the Keltner Channel indicator serving as dynamic resistance.
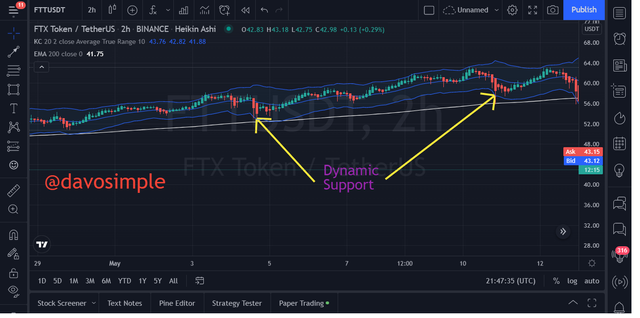
Here is another screenshot showing the Keltner Channel indicator serving as dynamic support.
6. What's your understanding of price breakouts in the Crypto ecosystem? Discuss breakouts with Keltner Channels towards different directions. (Screenshots required).
As earlier explained about what resistance and support are, there are times where price action pops out of the resistance and support zone and begin to make new swing highs and lows. The point at which price action pops out of resistance or support is refered to as Price Breakout.
The Keltner Channel indicator can play a great role in identifying ideal breakouts.
Whenever price action pops out of the upper band and closes above it, then we can say that a bullish breakout has occur.
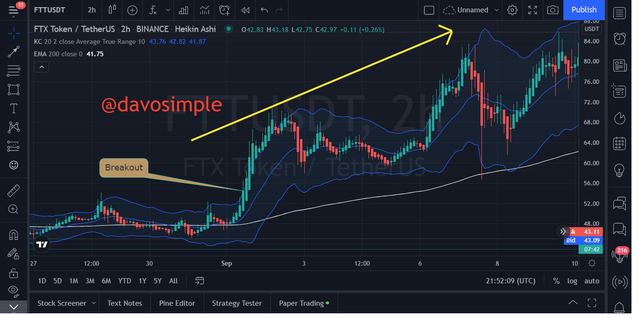
The screenshotshot above shows a chart of price breaking out of its resistance area to resume new swings.
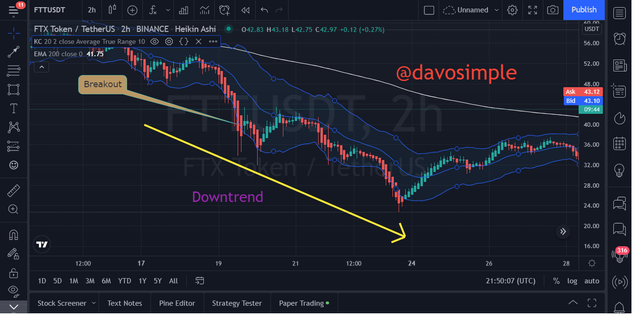
Whenever price action pops out of the lower band and closes below it, then we can say that a bearish breakout has occur.
7. What are the rules for trading breakouts with Keltner Channels? And show valid charts that work in line with the rules. (Screenshot required).
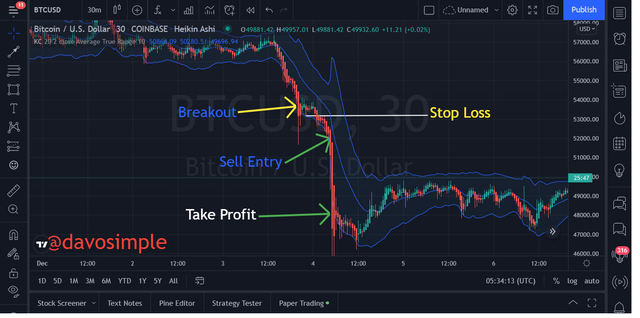
For bearish breakout, below are the rules for trading with the Keltner Channel indicator.
The trigger candle must pop out of the upper band and then should also close above the upper band.
Price should be seen making so new swing levels
Price action to be engulfed by the upper band and the middle line.
At the support level which is the middle line, stop loss can be set.
For bearish trend, below are the rules
The trigger candle should pop out of the lower band and close below it
Price should begin to make new swing level
Price should be engulfed by the middle line and the lower band
Stop loss should be set at a point below the support level.
8. Compare and Contrast Keltner Channels with Bollinger Bands. State distinctive differences.
The Keltner Channel have similar look and similar function as the Bollinger bands because both of them looks the same when placed on a chart and they are both volatility based indicators.
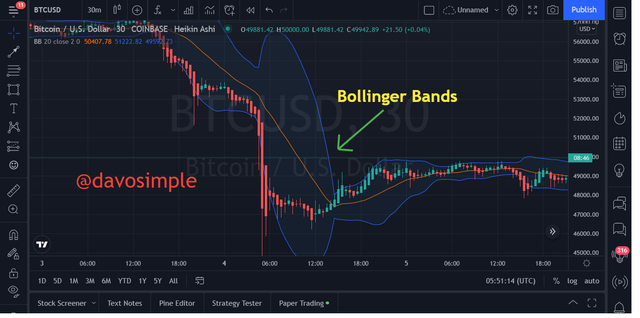
Differences between Keltner Channel and Bollinger Bands
| Keltner Channel | Bollinger Bands |
|---|---|
| It is calculated calculated using the Average True Range | The calculation for Bollinger Bands is done using Standard deviation |
| The middle line of the Keltner Channel is an exponential moving average | Middle line of the Bollinger Band is a simple moving average |
| Keltner channel is a bit slow to price Volatility | Bollinger Band is very quick to respond to volatility. |
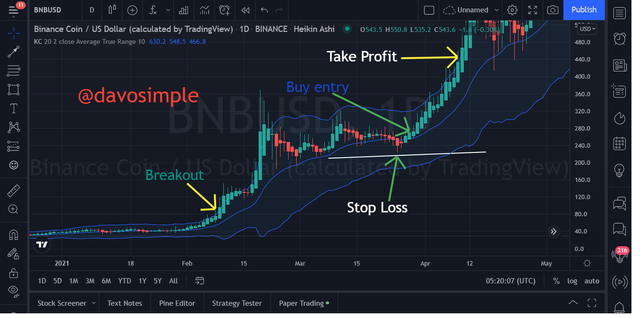
9. Place at least 4 trades (2 for sell position and 2 for buy position) using breakouts with Keltner Channels with proper trade management. Note: Use a Demo account for the purpose and it must be recent trade. (Screenshots required).
Buy Trade
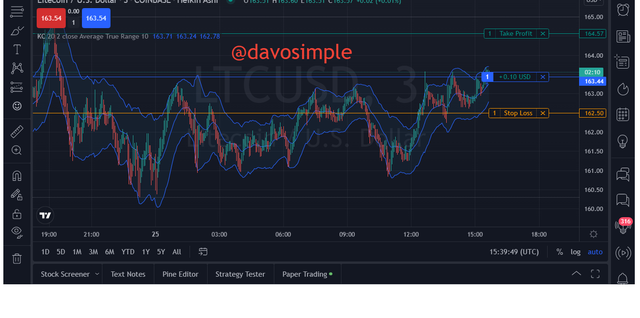
On a 3 minute chart of LTC/USD pair, i opened a buy trade after i noticed that price had popped out of the resistance band.
Buy Entry : 163.44
Take Profit : 164.57
Stop Loss : 162.50
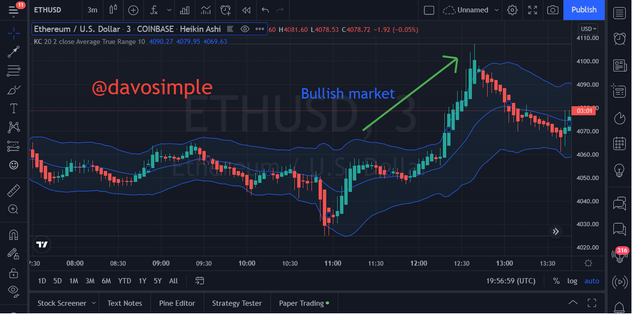
Buy Trade 2
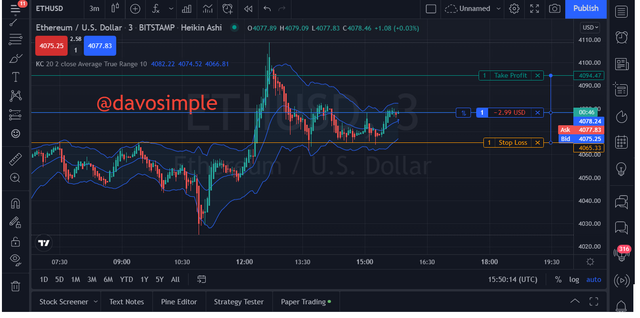
On a chart of ETH/USD, on a 3 minutes time frame, i noticed a break out above the upper band of the Indicator. Then i waited for some more candle to close before entering the trade.
Buy Entry : 4078.24
Take profit : 4094.47
Stop loss : 4065.33
Sell Trade
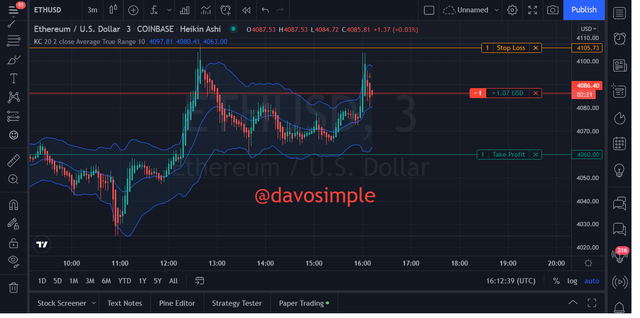
Here i noticed another breakout on a chart of ETH/USD. I noticed that as price broke above the upper band, it was going to first reverse. So i opened a sell trade for a quick profit.
Sell entry : 4086.40
Take Profit : 4060
Stop loss : 4105.73
Sell trade 2
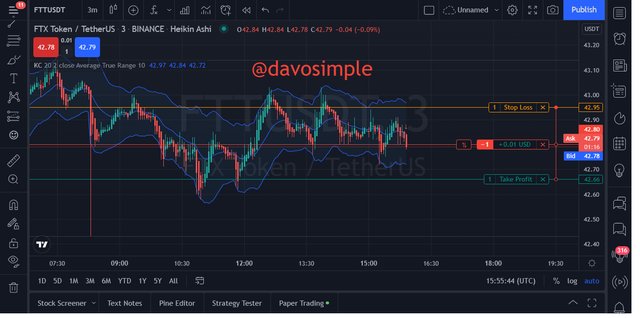
Sell entry : 42.79
Take Profit : 42.66
Stop Loss : 42.95
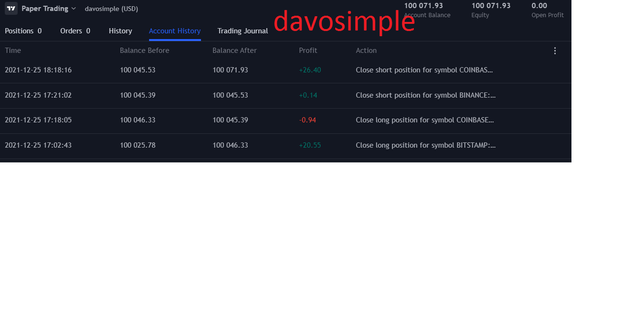
Here are the trade outcome
10. What are the advantages and disadvantages of Keltner Channels?
Advantages
The Keltner Channel indicator is very useful in idenfying trend direction.
Both the calculation and understanding of how the Keltner Channel indicator works is easy
It uses ATR to respond to volatility and as such, it smoothens out so much noise .
Disadvantages
The indicator cannot perfectly work alone to give great trade results except combined with other indicators.
The Indicator most times give late signal and as such, traders might miss some profitable trades.
Conclusion
Every indicator is known to be help a trader identify so great winning chances. The Keltner Channel indicator has proven itself in so many ways to be one of indicators to guide a trader during trading by Identifying ideal points where volatility is high and also serve as dynamic support and resistance.
The Indicator is much similar to Bollinger Band and they both help in identifying the level of volatility in the market. This indicator therefore is a great trading tool and effective use of it will help a trader in taking winning trades.
Thanks for having me.
All screenshots usd in this post are gotten from tradingview site.