

1. In your own words, give a simplified explanation of the CMF indicator with an example of how to calculate its value?
Chaikin Money Flow indicator is an indicator developed by Marc Chaikin, and it takes into account the high, low, close price and Money Flow Volume. So it works on the same concept of Accumulation and Distribution, but the Money flow volume is weighed upon with a specific period to obtain the CMF.
The period is generally taken as 20 or 21.
The CMF value fluctuates between +1 to -1, with 0 as the neutral zone.
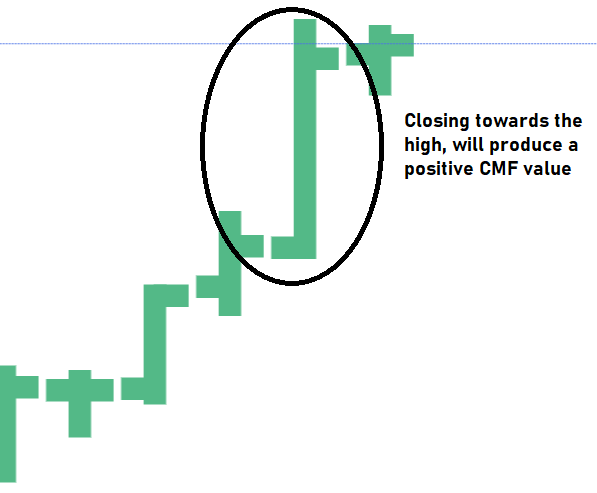
The asset's closing price is vital, along with the volume flowing in or out to indicate a buy or sell signal. If the closing price for a specific period is above the mid-line and towards the high, then the CMF reading will be a positive and higher value.
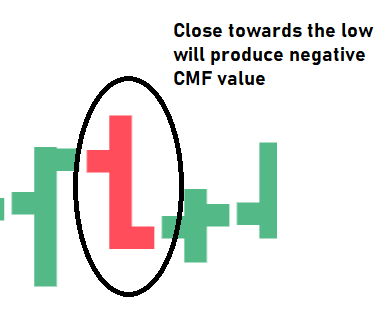
If the closing price for a specific period is below the mid-line and towards the low, then the CMF reading will be a negative value.
Above 0 is considered bullish, and below is considered bearish.
The formula for CMF:
CMF is a function of Money Flow Multiplier and Money Flow Volume. So first, you have to calculate the Money Flow Multiplier, which is again used to calculate Money Flow volume. Finally, it is weighed upon with a specific period to obtain the CMF value.
Money Flow Multiplier = [(Close - Low) - (High - Close)] /(High - Low)
Money Flow Volume= Money Flow Multiplier x Volume for the Period
CMF= [Sum of Money Flow Volume/ Sum of Volume]period= 20 or 21
Now I will show you a practical example of calculating CMF.
I have taken the data of Bitcoin from 24th September to 14th October 2021, and that is exactly 21 days. I have taken the data from Coinmarketcap.com and presented it in a table, and I have also used the formula in the excel sheet for Money Flow Multiplier and Money Flow Volume.
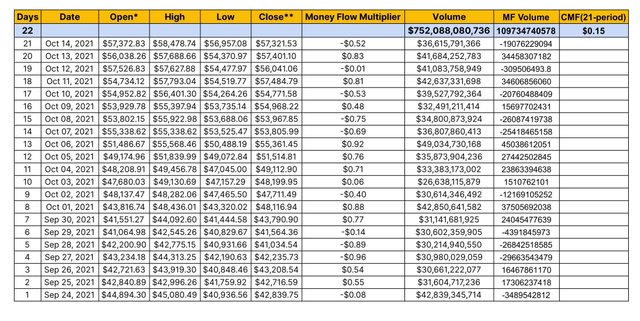
After calculating it in the excel sheet, the CMF(21-period) produced a value of 0.15, above 0, so it is a Bullish sign for BTC.
I have observed a few interesting things from this table.
| Date | Open* | High | Low | Close** | Money Flow Multiplier |
|---|---|---|---|---|---|
| Oct 06, 2021 | $51,486.67 | $55,568.46 | $50,488.19 | $55,361.45 | 0.92 |
When the close price is higher than the midpoint of high and low and closes near the high, the Money Flow Multiplier is close to 1. The Multiplier was close to 1 (0.92) on Oct 6, 2021, when BTC closed near its high.
| Date | Open* | High | Low | Close** | Money Flow Multiplier |
|---|---|---|---|---|---|
| Sep 27, 2021 | $43,234.18 | $44,313.25 | $42,190.63 | $42,235.73 | -0.96 |
When the price closes below the midpoint of high and low and closes near the low, the Money Flow Multiplier is close to -1. The Multiplier was close to -1(-0.96) on Sep 27, 2021, when BTC closed near the low.
Any reading above 0 is Bullish, but the price should remain above 0 to build the bullish momentum; otherwise, it will mislead the trader.
Any reading below 0 is Bearish, but the price should remain below 0 to build bearish momentum; otherwise, it will mislead the trader.

2. Demonstrate how to add the indicator to the chart on a platform other than the tradingview, highlighting how to modify the settings of the period(best setting).(screenshot required)
I use investing.com.
Go to investing.com, then sign up for a free account.
Select Crypto, then Crypto pair; BTC/USD
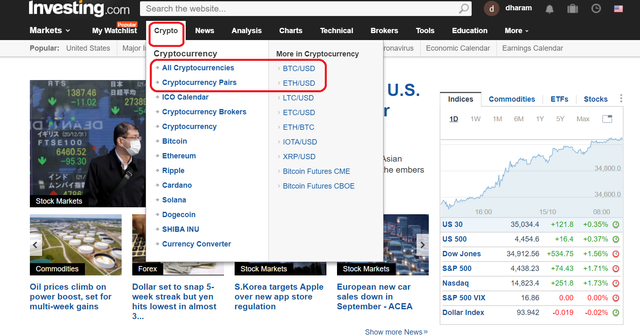
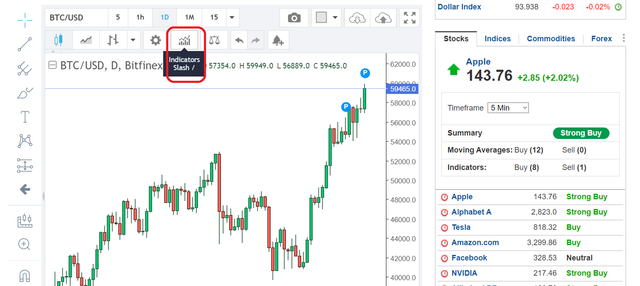
This is a 15 min chart, I would change it to 1D chart.
Click on indicator/slash.


Search for Chaikin Money Flow. Select Chain Money Flow. Now it is added to the chart at the bottom.
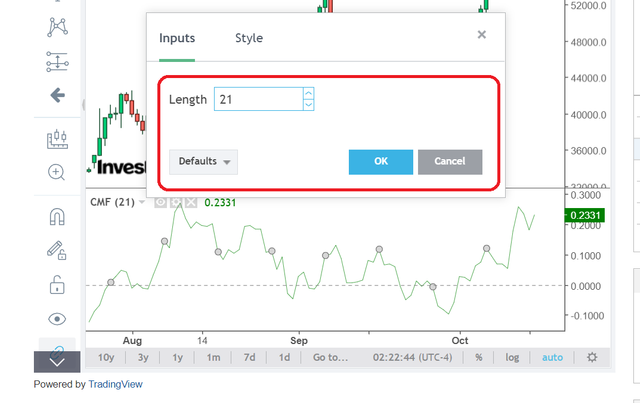
This CMF is a 20-period CMF; I will change it to a 21-period. Click on the setting symbol. Change the length to 21. Click OK.
The indicator is now added and configured with a 21-period CMF.
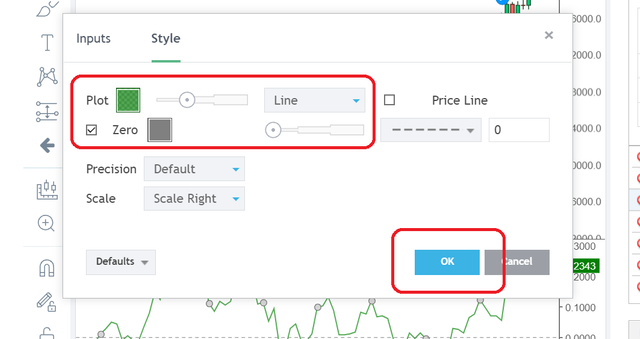
To change the Style and line of thickness, click on Style and change. Press OK.

3. What is the indicator’s role in confirming the direction of trend and determining entry and exit points (buy/sell)؟(screenshot required)
CMF is a volume based indicator, a kind of oscillator. The neutral zone is 0. and the upper and lower ranges are +1 and -1, respectively. If CMF starts rising above 0 and heading towards +1, it is a bullish sign. If the CMF fell below 0 and started heading towards -1 it is a bearish sign.
In the price line of an asset, the bullish sign is higher high and higher low, so in the CMF indicator window also we can apply that theory to confirm a bullish trend and vice versa for a bearish trend.
Just having a reading above 0 may not give the clean signal; it can be ambiguous and may also indicate a choppy session. For that, use cross-over and also use additional indicators like RSI and MACD.
As CMF is weighed upon 21-period, 21 EMA can also be used for better confirmation of a trade.
So I will explain the use of CMF alone and also in combination with RSI and 21 EMA.
Using CMF for Entry
On 30th Sep, 2021, BTC starts rising from 43000 and CMF also rises above 0. From 30th Sep to 15th Oct, 2021, the BTC has been strong in Bullish momentum with daily higher closing.
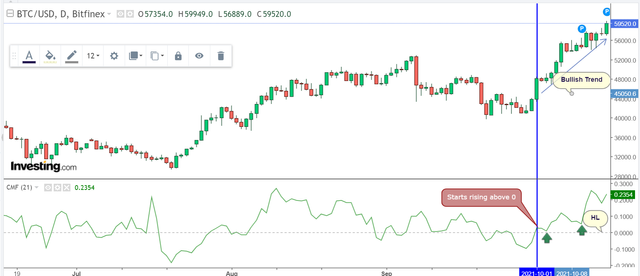
I have also checked with CMF indicator that it is continuously trading above 0. And as I said earlier, I can see a Higher Low(HL) in CMF. So CMF, along with the price of BTC, are both bullish, building momentum. I have not used any other indicator, but CMF is giving a solid and clean signal here.
Today CMF reads as 0.23, which is in the positive territory and constantly rising.
Stoploss
If I had taken BTC long on 30th Sep, 2021, based on CMF reading, I would put stop loss at 39600 because there were two lows at that area, one was from the previous consolidation, which was 39892, and the 40886 is the swing low of the recent move. So keeping a STOP LOSS just below the lower of the two make sense.
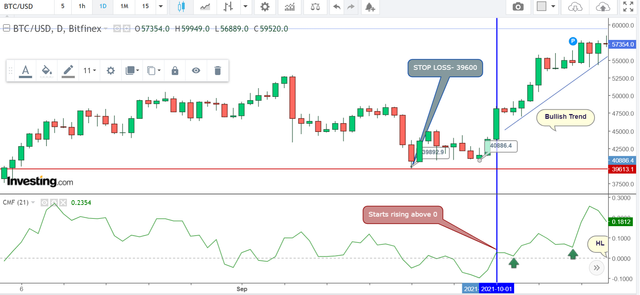
Using CMF with RSI and 21 EMA
The same chart, but additionally, RSI and 21 EMA are configured into the chart.
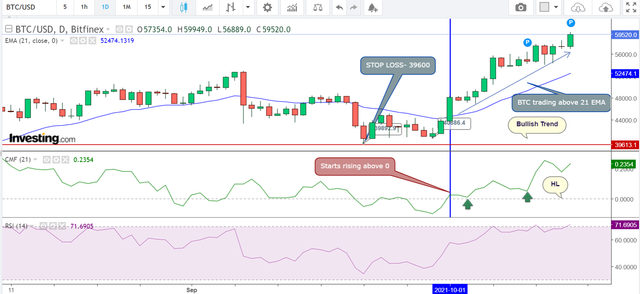
Long BTC based on CMF reading, get confirmation from 21 EMA. On 1st Oct 2021 BTC price line started to cross above 21-EMA, and it is still trading above 21 EMA and with greater separation between the 21 EMA and the price chart, which indicates strong momentum.
Blue Line is 21- EMA. The price chart and 21-EMA have a big gap and separation, and the separation is going wider each day because BTC price is closing higher each day. Generally, Higher High and Higher Low make the more considerable separation, which indicates momentum, and when we take CMF+21-EMA, both point to a vital bullish sign.
The RSI is also Bullish with a higher high and higher low.
When all the three RSI+CMF+21-EMA are bullish, it is a solid signal with strong Bullish momentum.
In some cases, there will be a misled signal when not all the three are Bullish.
In this case, RSI(14) is trading above 70, which is considered overbought. But in a strong Bull momentum, RSI sometimes remains in the overbought territory, it may also correct from 71 with BTC slightly correcting and then may again move up. Because momentum typically behaves in that way. Both 21- EMA and CMF are strongly Bullish now.

4. Trade with a crossover signal between the CMF and wider lines such as +/- 0.1 or +/- 0.15 or it can also be +/- 0.2, identify the most important signals that can be extracted using several examples. (screenshot required)
The neutral zone for CMF is always 0 line, and any reading above 0 can be a buy signal, but it may not be a neat and clean signal because the market behaves differently at different times. So relaying on a CMF reading with a figure above 0 will be a bad idea and mostly unreliable. For that reason, a buffer is used; it can be +/- 0.1 or +/- 0.15 or higher, it depends on the particular market.
Adding a buffer helps filter out the wrong signal, and the strategy should be to trade above that buffer to get clean and more reliable entries.
I will show you an example. This is an XRP/USD chart, and I have configured it with CMF(21-period).
From May to Oct 2021, CMF(21-period) has crossed above 0 at least 11 times; unfortunately, only 1 out of 11 is clean signal, rest 10 are bad signals. If I can add a buffer of +/- 0.1, I can get rid of these false signals.
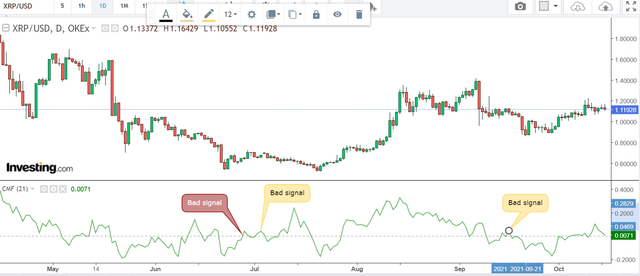
After adding the buffer of +/- 0.1, I can only find one clean signal.
In this chart:
- CMF crossing above +0.1 is Bullish
- CMF crossing below -0.1 is bearish
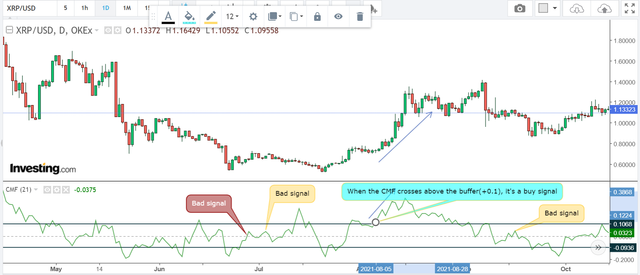
You can also use an alligator signal along with CMF. The sideway movements, consolidation, whipsaw, etc., all can be filtered out using a buffer in CMF. But always use other supplementary signals to confirm a trend.

5. How to trade with Divergence between the CMF and the price line? Does this trading strategy produce false signals?(screenshot required)
CMF Bullish Divergence
CMF Bullish divergence occurs when CMF reads above 0 and forming Higher High(HH) and Higher Low(HL), but the price line is creating Lower High(LH) and Lower Low(LL). It usually indicates that the trend is about to change from bearish to Bullish.
I will show you XRP/USD chart; the price is continually making Lower Highs(LH) and Lower Low(LL), but CMF(21-period) is printing Higher Highs(HH) and Higher Lows(HL). It's a hint that the market is about for a trend reversal, and that exactly happens in this chart; the price of XRP started printing Higher Highs again.
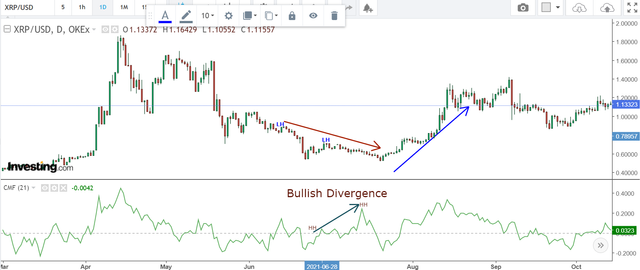
Bullish Divergence is a sign that the Bearish momentum is fading out and reaching a point of exhaustion. In a bearish divergence, the price changes from bullish to bearish in the near term.
To confirm it, always try to find at least one or two LH on the CMF line.
CMF Bearish Divergence
CMF Bearish divergence occurs when CMF starts approaching the zero line by forming Lower High(HH) and Lower Low(HL), but the price line is creating Higher High(LH) and Higher Low(LL). It usually indicates that the trend is about to change from Bullish to Bearish.
I will show you the BTC/USD chart where the price shows HH and the CMF(21-period) shows LL. And it finally reversed the trend, and BTC started turning lower.

Bearish Divergence is a sign that the Bullish momentum is fading out and reaching a point of exhaustion. In a bearish divergence, the price changes from bullish to bearish in the near term.
To confirm it, always try to find at least one or two LH on the CMF line.
To add more weight to the Bullish and Bearish Divergence further, the trader should look for Evening star and Morning star candles in the price action.
Does this trading strategy produce false signals?
It can produce a false signal if the momentum is strong. Just like the RSI can stay for a more extended period in the oversold region, the Bullish Divergence; it can mislead a trader, and the seller may continue to have the edge over the buyers. Similarly, in the case of Bearish Divergence, the Buyer may continue to buy to make it a fake bearish divergence.
So always use the combination of signals for better confirmation.
(1) CMF+RSI+21-EMA
(2) CMF+MACD+21-EMA
(2) CMF+Stochistics+21-EMA
A trader can also use the cross-overs of the different periods of CMF. Just like the Moving Averages, the traders can use 21-CMF and 50-CMF.

Conclusion
CMF uses money flow volume and takes the price's high, low, and close into account. It is a perfect oscillator, but the bullish and bearish biases sometimes need additional indicators to confirm a trend.
I usually prefer CMF and RSI. If RSI starts trading above 45 and CMF starts rising above 0, it will be a perfect entry. If the RSI falls below 45 and CMF also falls below 0, it is a strong bearish momentum. To filter out the sideway movement, an alligator signal can be used with CMF, and a buffer of +/- 0.1 also helps to filter out the false and bad signals.
For Bullish and Bearish Divergence, a morning star and evening star in price action can also help, but it may not always produce such candles.
In summary, CMF is reliable, but it depends on a particular market and the price action. And condition applies as discussed in this post.

Thank You.
Cc:
@kouba01
Hello @dharamps,
Thank you for participating in the 6th Week Crypto Course in its 4th season and for your efforts to complete the suggested tasks, you deserve a Total|8.5/10 rating, according to the following scale:
My review :
Good work in which the answers differed in their analysis and interpretation, and these are some notes.
You need to dig deeper to determine the best settings for the period of the CMF indicator.
The fourth answer did not display several signals resulting from the crossover of the indicator line with the extended lines.
Thanks again for your effort, and we look forward to reading your next work.
Sincerely,@kouba01
Downvoting a post can decrease pending rewards and make it less visible. Common reasons:
Submit
You have been upvoted by @sapwood, a Country Representative from INDIA. We are voting with the Steemit Community Curator @steemcurator07 account to support the newcomers coming into Steemit.
Engagement is essential to foster a sense of community. Therefore we would request our members to visit each other's post and make insightful comments.
Thank you.
Downvoting a post can decrease pending rewards and make it less visible. Common reasons:
Submit